Houma vs Hispanic or Latino 3rd Grade
COMPARE
Houma
Hispanic or Latino
3rd Grade
3rd Grade Comparison
Houma
Hispanics or Latinos
97.1%
3RD GRADE
0.1/ 100
METRIC RATING
283rd/ 347
METRIC RANK
96.5%
3RD GRADE
0.0/ 100
METRIC RATING
318th/ 347
METRIC RANK
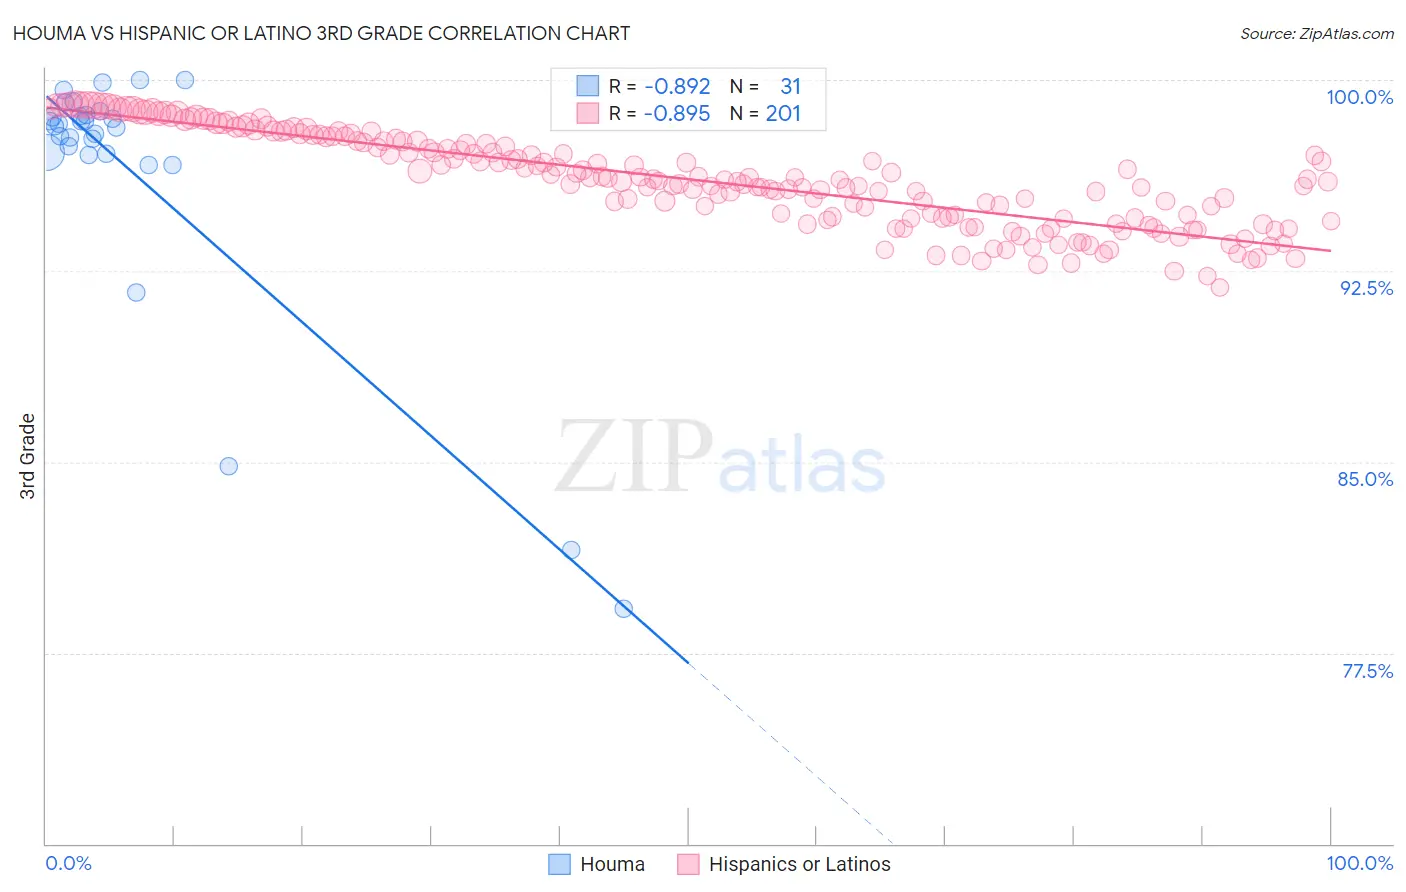
Houma vs Hispanic or Latino 3rd Grade Correlation Chart
The statistical analysis conducted on geographies consisting of 36,795,916 people shows a very strong negative correlation between the proportion of Houma and percentage of population with at least 3rd grade education in the United States with a correlation coefficient (R) of -0.892 and weighted average of 97.1%. Similarly, the statistical analysis conducted on geographies consisting of 578,615,396 people shows a very strong negative correlation between the proportion of Hispanics or Latinos and percentage of population with at least 3rd grade education in the United States with a correlation coefficient (R) of -0.895 and weighted average of 96.5%, a difference of 0.63%.
3rd Grade Correlation Summary
| Measurement | Houma | Hispanic or Latino |
| Minimum | 79.2% | 91.8% |
| Maximum | 100.0% | 99.1% |
| Range | 20.8% | 7.2% |
| Mean | 96.5% | 96.1% |
| Median | 98.2% | 96.1% |
| Interquartile 25% (IQ1) | 97.1% | 94.6% |
| Interquartile 75% (IQ3) | 98.6% | 97.6% |
| Interquartile Range (IQR) | 1.5% | 3.1% |
| Standard Deviation (Sample) | 5.1% | 1.8% |
| Standard Deviation (Population) | 5.1% | 1.8% |
Similar Demographics by 3rd Grade
Demographics Similar to Houma by 3rd Grade
In terms of 3rd grade, the demographic groups most similar to Houma are Afghan (97.1%, a difference of 0.0%), Immigrants from Philippines (97.2%, a difference of 0.020%), Immigrants from Ghana (97.2%, a difference of 0.020%), Barbadian (97.2%, a difference of 0.020%), and Immigrants from Trinidad and Tobago (97.1%, a difference of 0.020%).
| Demographics | Rating | Rank | 3rd Grade |
| Immigrants | Bolivia | 0.1 /100 | #276 | Tragic 97.2% |
| Trinidadians and Tobagonians | 0.1 /100 | #277 | Tragic 97.2% |
| Immigrants | Western Africa | 0.1 /100 | #278 | Tragic 97.2% |
| Immigrants | Philippines | 0.1 /100 | #279 | Tragic 97.2% |
| Immigrants | Ghana | 0.1 /100 | #280 | Tragic 97.2% |
| Barbadians | 0.1 /100 | #281 | Tragic 97.2% |
| Afghans | 0.1 /100 | #282 | Tragic 97.1% |
| Houma | 0.1 /100 | #283 | Tragic 97.1% |
| Immigrants | Trinidad and Tobago | 0.0 /100 | #284 | Tragic 97.1% |
| Immigrants | Hong Kong | 0.0 /100 | #285 | Tragic 97.1% |
| Immigrants | Barbados | 0.0 /100 | #286 | Tragic 97.1% |
| Immigrants | St. Vincent and the Grenadines | 0.0 /100 | #287 | Tragic 97.1% |
| Immigrants | West Indies | 0.0 /100 | #288 | Tragic 97.1% |
| Immigrants | Thailand | 0.0 /100 | #289 | Tragic 97.1% |
| Immigrants | Portugal | 0.0 /100 | #290 | Tragic 97.0% |
Demographics Similar to Hispanics or Latinos by 3rd Grade
In terms of 3rd grade, the demographic groups most similar to Hispanics or Latinos are Vietnamese (96.5%, a difference of 0.010%), Immigrants from Bangladesh (96.6%, a difference of 0.020%), Immigrants from Nicaragua (96.5%, a difference of 0.020%), Indonesian (96.5%, a difference of 0.030%), and Immigrants from Belize (96.5%, a difference of 0.030%).
| Demographics | Rating | Rank | 3rd Grade |
| Immigrants | Guyana | 0.0 /100 | #311 | Tragic 96.6% |
| Immigrants | Laos | 0.0 /100 | #312 | Tragic 96.6% |
| Immigrants | Ecuador | 0.0 /100 | #313 | Tragic 96.6% |
| Belizeans | 0.0 /100 | #314 | Tragic 96.6% |
| Immigrants | Azores | 0.0 /100 | #315 | Tragic 96.6% |
| Immigrants | Burma/Myanmar | 0.0 /100 | #316 | Tragic 96.6% |
| Immigrants | Bangladesh | 0.0 /100 | #317 | Tragic 96.6% |
| Hispanics or Latinos | 0.0 /100 | #318 | Tragic 96.5% |
| Vietnamese | 0.0 /100 | #319 | Tragic 96.5% |
| Immigrants | Nicaragua | 0.0 /100 | #320 | Tragic 96.5% |
| Indonesians | 0.0 /100 | #321 | Tragic 96.5% |
| Immigrants | Belize | 0.0 /100 | #322 | Tragic 96.5% |
| Hondurans | 0.0 /100 | #323 | Tragic 96.5% |
| Dominicans | 0.0 /100 | #324 | Tragic 96.4% |
| Mexican American Indians | 0.0 /100 | #325 | Tragic 96.4% |