Ukrainian vs Hispanic or Latino Median Female Earnings
COMPARE
Ukrainian
Hispanic or Latino
Median Female Earnings
Median Female Earnings Comparison
Ukrainians
Hispanics or Latinos
$42,015
MEDIAN FEMALE EARNINGS
99.2/ 100
METRIC RATING
90th/ 347
METRIC RANK
$34,421
MEDIAN FEMALE EARNINGS
0.0/ 100
METRIC RATING
321st/ 347
METRIC RANK
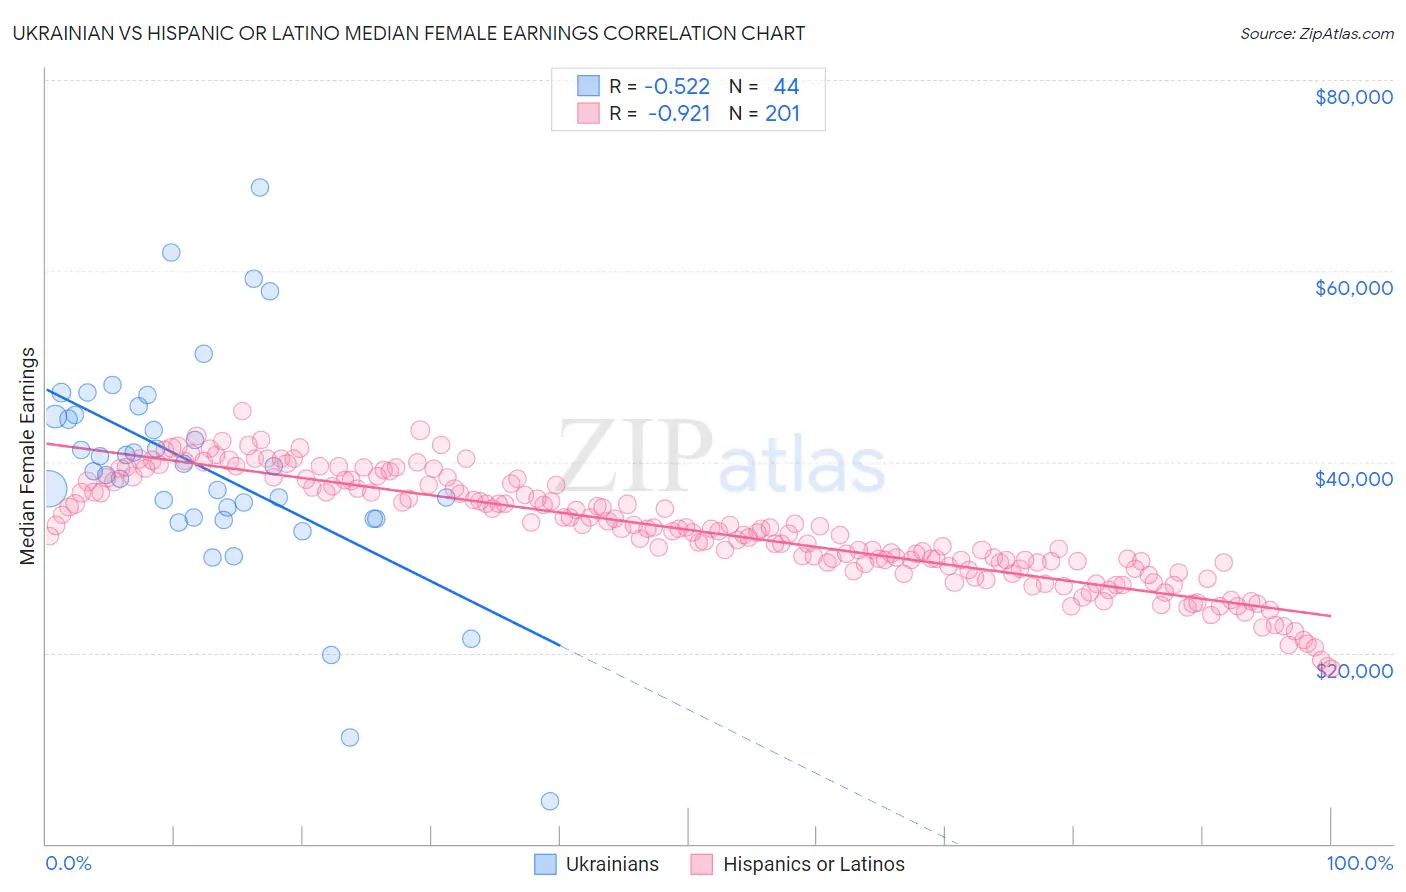
Ukrainian vs Hispanic or Latino Median Female Earnings Correlation Chart
The statistical analysis conducted on geographies consisting of 448,339,242 people shows a substantial negative correlation between the proportion of Ukrainians and median female earnings in the United States with a correlation coefficient (R) of -0.522 and weighted average of $42,015. Similarly, the statistical analysis conducted on geographies consisting of 576,408,721 people shows a near-perfect negative correlation between the proportion of Hispanics or Latinos and median female earnings in the United States with a correlation coefficient (R) of -0.921 and weighted average of $34,421, a difference of 22.1%.
Median Female Earnings Correlation Summary
| Measurement | Ukrainian | Hispanic or Latino |
| Minimum | $4,400 | $18,390 |
| Maximum | $68,750 | $45,279 |
| Range | $64,350 | $26,890 |
| Mean | $39,267 | $32,838 |
| Median | $39,270 | $32,964 |
| Interquartile 25% (IQ1) | $34,102 | $29,181 |
| Interquartile 75% (IQ3) | $44,856 | $37,606 |
| Interquartile Range (IQR) | $10,753 | $8,426 |
| Standard Deviation (Sample) | $11,661 | $5,710 |
| Standard Deviation (Population) | $11,527 | $5,696 |
Similar Demographics by Median Female Earnings
Demographics Similar to Ukrainians by Median Female Earnings
In terms of median female earnings, the demographic groups most similar to Ukrainians are Immigrants from Western Europe ($41,990, a difference of 0.060%), Immigrants from Afghanistan ($42,055, a difference of 0.10%), Argentinean ($41,952, a difference of 0.15%), Immigrants from Northern Africa ($42,084, a difference of 0.16%), and Immigrants from Grenada ($41,932, a difference of 0.20%).
| Demographics | Rating | Rank | Median Female Earnings |
| Immigrants | Sierra Leone | 99.5 /100 | #83 | Exceptional $42,214 |
| Armenians | 99.5 /100 | #84 | Exceptional $42,212 |
| Laotians | 99.4 /100 | #85 | Exceptional $42,133 |
| Immigrants | St. Vincent and the Grenadines | 99.3 /100 | #86 | Exceptional $42,108 |
| Lithuanians | 99.3 /100 | #87 | Exceptional $42,108 |
| Immigrants | Northern Africa | 99.3 /100 | #88 | Exceptional $42,084 |
| Immigrants | Afghanistan | 99.3 /100 | #89 | Exceptional $42,055 |
| Ukrainians | 99.2 /100 | #90 | Exceptional $42,015 |
| Immigrants | Western Europe | 99.2 /100 | #91 | Exceptional $41,990 |
| Argentineans | 99.1 /100 | #92 | Exceptional $41,952 |
| Immigrants | Grenada | 99.0 /100 | #93 | Exceptional $41,932 |
| Moroccans | 98.9 /100 | #94 | Exceptional $41,872 |
| Immigrants | Netherlands | 98.9 /100 | #95 | Exceptional $41,870 |
| South Africans | 98.8 /100 | #96 | Exceptional $41,825 |
| Immigrants | Hungary | 98.8 /100 | #97 | Exceptional $41,820 |
Demographics Similar to Hispanics or Latinos by Median Female Earnings
In terms of median female earnings, the demographic groups most similar to Hispanics or Latinos are Chickasaw ($34,414, a difference of 0.020%), Seminole ($34,385, a difference of 0.11%), Immigrants from Congo ($34,317, a difference of 0.31%), Immigrants from Honduras ($34,647, a difference of 0.66%), and Shoshone ($34,677, a difference of 0.74%).
| Demographics | Rating | Rank | Median Female Earnings |
| Apache | 0.0 /100 | #314 | Tragic $34,895 |
| Pennsylvania Germans | 0.0 /100 | #315 | Tragic $34,802 |
| Cherokee | 0.0 /100 | #316 | Tragic $34,742 |
| Potawatomi | 0.0 /100 | #317 | Tragic $34,739 |
| Immigrants | Yemen | 0.0 /100 | #318 | Tragic $34,693 |
| Shoshone | 0.0 /100 | #319 | Tragic $34,677 |
| Immigrants | Honduras | 0.0 /100 | #320 | Tragic $34,647 |
| Hispanics or Latinos | 0.0 /100 | #321 | Tragic $34,421 |
| Chickasaw | 0.0 /100 | #322 | Tragic $34,414 |
| Seminole | 0.0 /100 | #323 | Tragic $34,385 |
| Immigrants | Congo | 0.0 /100 | #324 | Tragic $34,317 |
| Dutch West Indians | 0.0 /100 | #325 | Tragic $34,106 |
| Kiowa | 0.0 /100 | #326 | Tragic $34,074 |
| Cajuns | 0.0 /100 | #327 | Tragic $34,034 |
| Immigrants | Central America | 0.0 /100 | #328 | Tragic $33,953 |