Hmong vs Chickasaw Householder Income Over 65 years
COMPARE
Hmong
Chickasaw
Householder Income Over 65 years
Householder Income Over 65 years Comparison
Hmong
Chickasaw
$56,339
HOUSEHOLDER INCOME OVER 65 YEARS
0.8/ 100
METRIC RATING
244th/ 347
METRIC RANK
$53,732
HOUSEHOLDER INCOME OVER 65 YEARS
0.1/ 100
METRIC RATING
290th/ 347
METRIC RANK
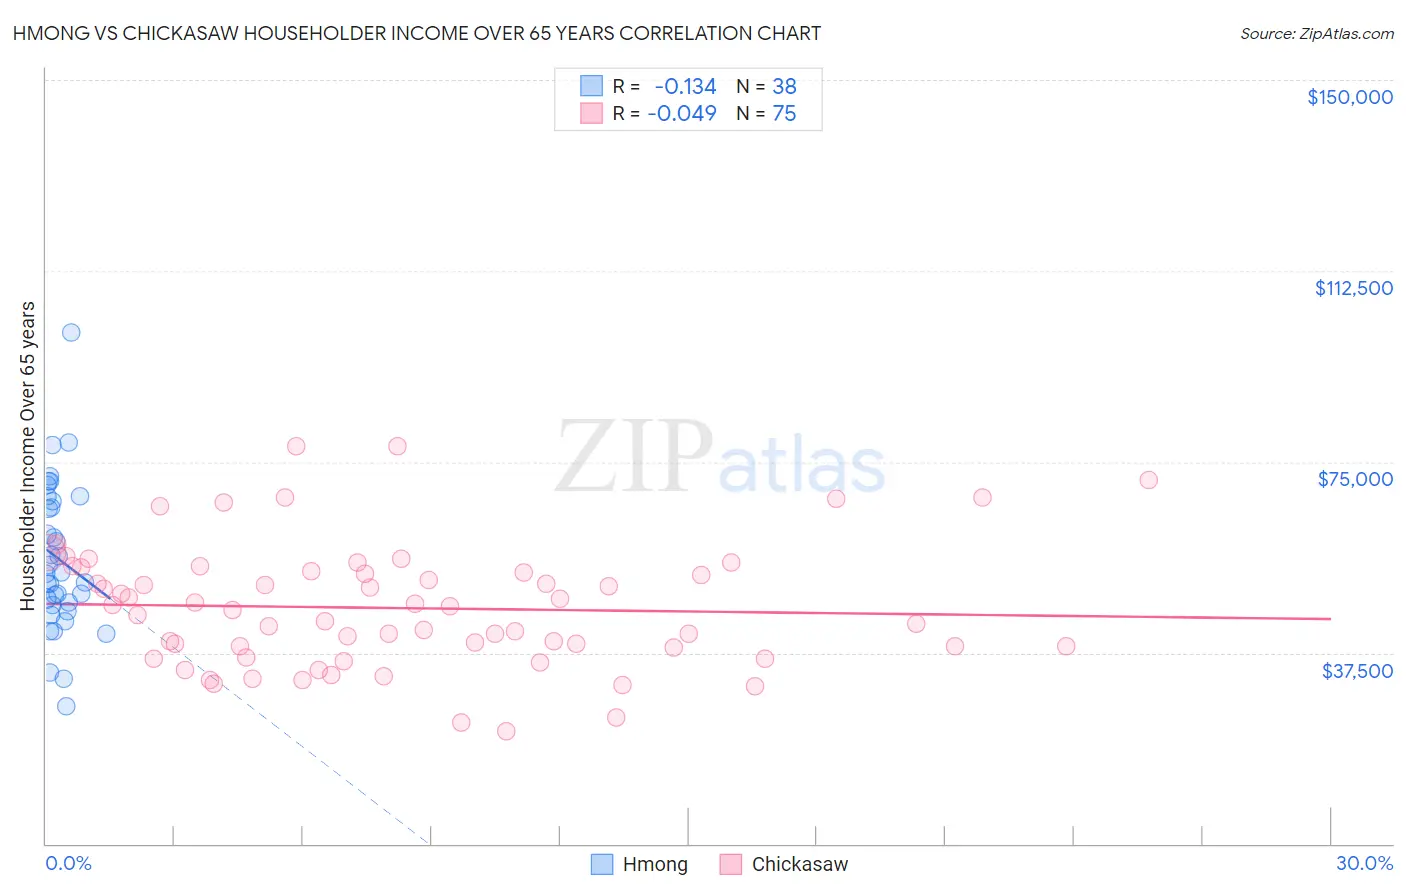
Hmong vs Chickasaw Householder Income Over 65 years Correlation Chart
The statistical analysis conducted on geographies consisting of 24,664,732 people shows a poor negative correlation between the proportion of Hmong and household income with householder over the age of 65 in the United States with a correlation coefficient (R) of -0.134 and weighted average of $56,339. Similarly, the statistical analysis conducted on geographies consisting of 147,447,957 people shows no correlation between the proportion of Chickasaw and household income with householder over the age of 65 in the United States with a correlation coefficient (R) of -0.049 and weighted average of $53,732, a difference of 4.9%.
Householder Income Over 65 years Correlation Summary
| Measurement | Hmong | Chickasaw |
| Minimum | $27,125 | $22,146 |
| Maximum | $100,402 | $78,125 |
| Range | $73,277 | $55,979 |
| Mean | $56,016 | $46,305 |
| Median | $53,213 | $45,875 |
| Interquartile 25% (IQ1) | $46,982 | $38,542 |
| Interquartile 75% (IQ3) | $67,354 | $53,486 |
| Interquartile Range (IQR) | $20,372 | $14,944 |
| Standard Deviation (Sample) | $14,666 | $12,086 |
| Standard Deviation (Population) | $14,471 | $12,005 |
Similar Demographics by Householder Income Over 65 years
Demographics Similar to Hmong by Householder Income Over 65 years
In terms of householder income over 65 years, the demographic groups most similar to Hmong are Guyanese ($56,351, a difference of 0.020%), Immigrants from Uzbekistan ($56,331, a difference of 0.020%), Central American ($56,321, a difference of 0.030%), Yaqui ($56,417, a difference of 0.14%), and Yakama ($56,234, a difference of 0.19%).
| Demographics | Rating | Rank | Householder Income Over 65 years |
| Immigrants | Panama | 1.5 /100 | #237 | Tragic $56,944 |
| Fijians | 1.2 /100 | #238 | Tragic $56,768 |
| Immigrants | Laos | 1.2 /100 | #239 | Tragic $56,722 |
| Sub-Saharan Africans | 1.0 /100 | #240 | Tragic $56,615 |
| Immigrants | Guyana | 0.9 /100 | #241 | Tragic $56,495 |
| Yaqui | 0.8 /100 | #242 | Tragic $56,417 |
| Guyanese | 0.8 /100 | #243 | Tragic $56,351 |
| Hmong | 0.8 /100 | #244 | Tragic $56,339 |
| Immigrants | Uzbekistan | 0.8 /100 | #245 | Tragic $56,331 |
| Central Americans | 0.8 /100 | #246 | Tragic $56,321 |
| Yakama | 0.7 /100 | #247 | Tragic $56,234 |
| Vietnamese | 0.6 /100 | #248 | Tragic $56,143 |
| Mexican American Indians | 0.6 /100 | #249 | Tragic $56,089 |
| Immigrants | Bosnia and Herzegovina | 0.5 /100 | #250 | Tragic $55,986 |
| Immigrants | Portugal | 0.5 /100 | #251 | Tragic $55,924 |
Demographics Similar to Chickasaw by Householder Income Over 65 years
In terms of householder income over 65 years, the demographic groups most similar to Chickasaw are Iroquois ($53,737, a difference of 0.010%), African ($53,711, a difference of 0.040%), Immigrants from Barbados ($53,766, a difference of 0.060%), Paiute ($53,762, a difference of 0.060%), and Shoshone ($53,681, a difference of 0.090%).
| Demographics | Rating | Rank | Householder Income Over 65 years |
| Immigrants | Liberia | 0.1 /100 | #283 | Tragic $53,967 |
| Immigrants | Guatemala | 0.1 /100 | #284 | Tragic $53,950 |
| Mexicans | 0.1 /100 | #285 | Tragic $53,897 |
| Chippewa | 0.1 /100 | #286 | Tragic $53,847 |
| Immigrants | Barbados | 0.1 /100 | #287 | Tragic $53,766 |
| Paiute | 0.1 /100 | #288 | Tragic $53,762 |
| Iroquois | 0.1 /100 | #289 | Tragic $53,737 |
| Chickasaw | 0.1 /100 | #290 | Tragic $53,732 |
| Africans | 0.0 /100 | #291 | Tragic $53,711 |
| Shoshone | 0.0 /100 | #292 | Tragic $53,681 |
| Immigrants | Belize | 0.0 /100 | #293 | Tragic $53,665 |
| Senegalese | 0.0 /100 | #294 | Tragic $53,591 |
| Immigrants | Central America | 0.0 /100 | #295 | Tragic $53,420 |
| Immigrants | Somalia | 0.0 /100 | #296 | Tragic $53,333 |
| Immigrants | Latin America | 0.0 /100 | #297 | Tragic $53,265 |