Hmong vs Chickasaw No Schooling Completed
COMPARE
Hmong
Chickasaw
No Schooling Completed
No Schooling Completed Comparison
Hmong
Chickasaw
1.9%
NO SCHOOLING COMPLETED
88.5/ 100
METRIC RATING
135th/ 347
METRIC RANK
1.7%
NO SCHOOLING COMPLETED
99.6/ 100
METRIC RATING
69th/ 347
METRIC RANK
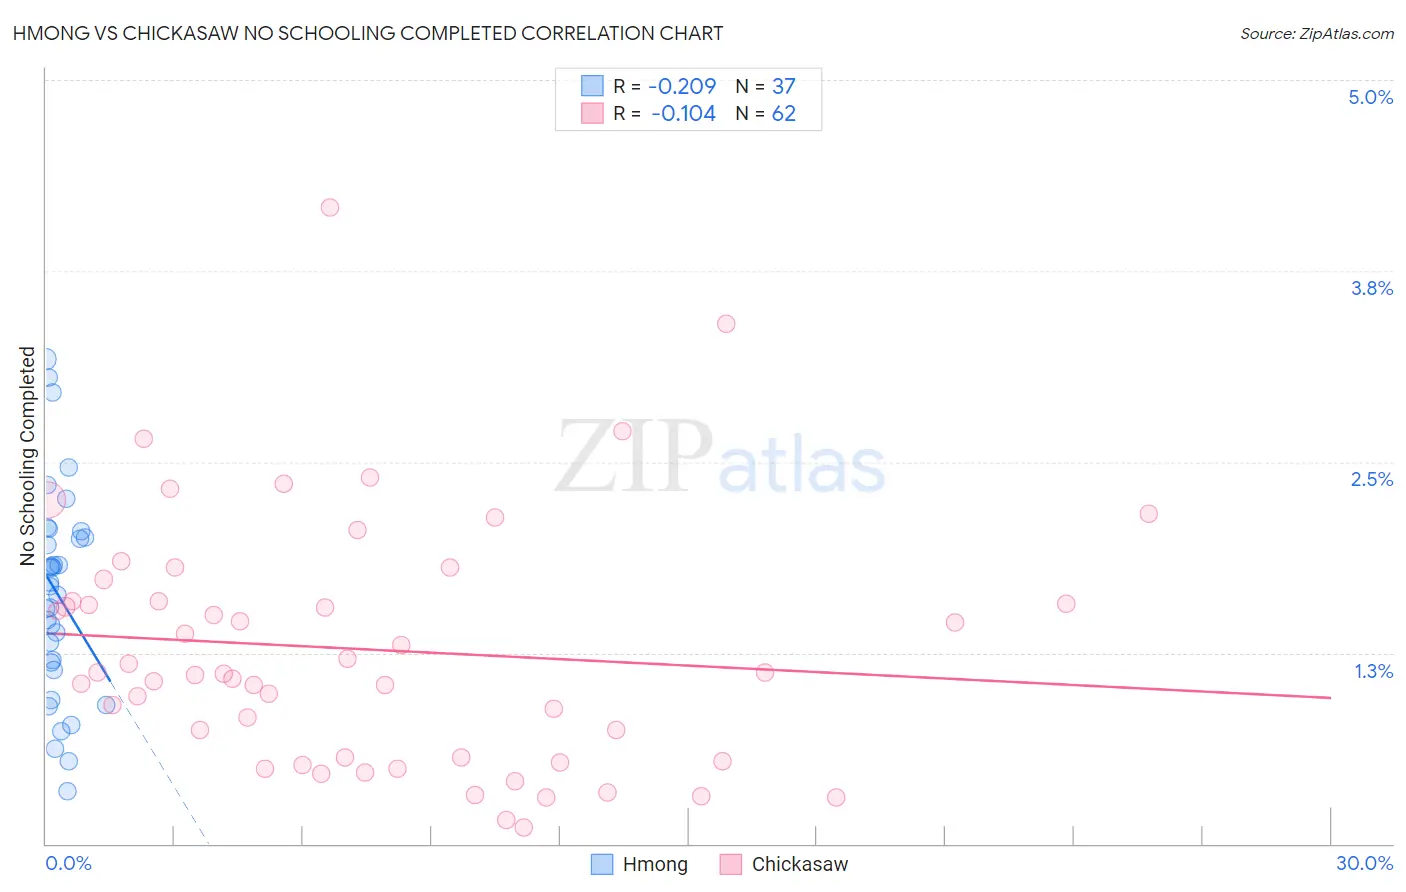
Hmong vs Chickasaw No Schooling Completed Correlation Chart
The statistical analysis conducted on geographies consisting of 24,657,468 people shows a weak negative correlation between the proportion of Hmong and percentage of population with no schooling in the United States with a correlation coefficient (R) of -0.209 and weighted average of 1.9%. Similarly, the statistical analysis conducted on geographies consisting of 146,942,262 people shows a poor negative correlation between the proportion of Chickasaw and percentage of population with no schooling in the United States with a correlation coefficient (R) of -0.104 and weighted average of 1.7%, a difference of 15.0%.
No Schooling Completed Correlation Summary
| Measurement | Hmong | Chickasaw |
| Minimum | 0.34% | 0.11% |
| Maximum | 3.2% | 4.2% |
| Range | 2.8% | 4.1% |
| Mean | 1.6% | 1.3% |
| Median | 1.7% | 1.1% |
| Interquartile 25% (IQ1) | 1.2% | 0.57% |
| Interquartile 75% (IQ3) | 2.0% | 1.6% |
| Interquartile Range (IQR) | 0.86% | 1.0% |
| Standard Deviation (Sample) | 0.68% | 0.81% |
| Standard Deviation (Population) | 0.67% | 0.80% |
Similar Demographics by No Schooling Completed
Demographics Similar to Hmong by No Schooling Completed
In terms of no schooling completed, the demographic groups most similar to Hmong are Burmese (1.9%, a difference of 0.090%), Menominee (1.9%, a difference of 0.40%), Immigrants from Turkey (1.9%, a difference of 0.65%), Colville (1.9%, a difference of 0.75%), and Filipino (2.0%, a difference of 0.95%).
| Demographics | Rating | Rank | No Schooling Completed |
| Spaniards | 92.3 /100 | #128 | Exceptional 1.9% |
| Seminole | 92.0 /100 | #129 | Exceptional 1.9% |
| Palestinians | 91.8 /100 | #130 | Exceptional 1.9% |
| Immigrants | Hungary | 91.6 /100 | #131 | Exceptional 1.9% |
| Colville | 90.4 /100 | #132 | Exceptional 1.9% |
| Immigrants | Turkey | 90.2 /100 | #133 | Exceptional 1.9% |
| Menominee | 89.6 /100 | #134 | Excellent 1.9% |
| Hmong | 88.5 /100 | #135 | Excellent 1.9% |
| Burmese | 88.2 /100 | #136 | Excellent 1.9% |
| Filipinos | 85.5 /100 | #137 | Excellent 2.0% |
| Immigrants | Israel | 85.4 /100 | #138 | Excellent 2.0% |
| Jordanians | 84.5 /100 | #139 | Excellent 2.0% |
| Marshallese | 83.5 /100 | #140 | Excellent 2.0% |
| Immigrants | Greece | 83.5 /100 | #141 | Excellent 2.0% |
| Venezuelans | 81.5 /100 | #142 | Excellent 2.0% |
Demographics Similar to Chickasaw by No Schooling Completed
In terms of no schooling completed, the demographic groups most similar to Chickasaw are Immigrants from Lithuania (1.7%, a difference of 0.27%), Immigrants from Netherlands (1.7%, a difference of 0.97%), Immigrants from Austria (1.7%, a difference of 1.0%), Canadian (1.7%, a difference of 1.2%), and Immigrants from England (1.7%, a difference of 1.3%).
| Demographics | Rating | Rank | No Schooling Completed |
| Immigrants | Northern Europe | 99.8 /100 | #62 | Exceptional 1.7% |
| Russians | 99.8 /100 | #63 | Exceptional 1.7% |
| New Zealanders | 99.7 /100 | #64 | Exceptional 1.7% |
| Serbians | 99.7 /100 | #65 | Exceptional 1.7% |
| Canadians | 99.7 /100 | #66 | Exceptional 1.7% |
| Immigrants | Austria | 99.7 /100 | #67 | Exceptional 1.7% |
| Immigrants | Lithuania | 99.7 /100 | #68 | Exceptional 1.7% |
| Chickasaw | 99.6 /100 | #69 | Exceptional 1.7% |
| Immigrants | Netherlands | 99.6 /100 | #70 | Exceptional 1.7% |
| Immigrants | England | 99.5 /100 | #71 | Exceptional 1.7% |
| Cajuns | 99.5 /100 | #72 | Exceptional 1.7% |
| Immigrants | India | 99.4 /100 | #73 | Exceptional 1.7% |
| Zimbabweans | 99.4 /100 | #74 | Exceptional 1.7% |
| Immigrants | Belgium | 99.3 /100 | #75 | Exceptional 1.7% |
| Cherokee | 99.3 /100 | #76 | Exceptional 1.7% |