Hmong vs Immigrants from Bulgaria Householder Income Over 65 years

COMPARE

Hmong
Race
Ancestry
AfghanAfricanAlaska NativeAlaskan AthabascanAlbanianAleutAlsatianAmericanApacheArabArapahoArgentineanArmenianAssyrian/Chaldean/SyriacAustralianAustrianBahamianBangladeshiBarbadianBasqueBelgianBelizeanBermudanBhutaneseBlackfeetBolivianBrazilianBritishBritish West IndianBulgarianBurmeseCajunCambodianCanadianCape VerdeanCarpatho RusynCelticCentral AmericanCentral American IndianCherokeeCheyenneChickasawChileanChineseChippewaChoctawColombianColvilleComancheCosta RicanCreeCreekCroatianCrowCubanCypriotCzechCzechoslovakianDanishDelawareDominicanDutchDutch West IndianEastern EuropeanEcuadorianEgyptianEnglishEstonianEthiopianEuropeanFijianFilipinoFinnishFrenchFrench American IndianFrench CanadianGermanGerman RussianGhanaianGreekGuamanian/ChamorroGuatemalanGuyaneseHaitianHmongHonduranHopiHoumaHungarianIcelanderIndian (Asian)IndonesianInupiatIranianIraqiIrishIroquoisIsraeliItalianJamaicanJapaneseJordanianKenyanKiowaKoreanLaotianLatvianLebaneseLiberianLithuanianLumbeeLuxembourgerMacedonianMalaysianMalteseMarshalleseMenomineeMexicanMexican American IndianMongolianMoroccanNative HawaiianNavajoNepaleseNew ZealanderNicaraguanNigerianNorthern EuropeanNorwegianOkinawanOsageOttawaPaiutePakistaniPalestinianPanamanianParaguayanPennsylvania GermanPeruvianPimaPolishPortuguesePotawatomiPuebloPuerto RicanPuget Sound SalishRomanianRussianSalvadoranSamoanScandinavianScotch-IrishScottishSeminoleSenegaleseSerbianShoshoneSierra LeoneanSiouxSlavicSlovakSloveneSomaliSouth AfricanSouth AmericanSouth American IndianSoviet UnionSpaniardSpanishSpanish AmericanSpanish American IndianSri LankanSubsaharan AfricanSudaneseSwedishSwissSyrianTaiwaneseThaiTlingit-HaidaTohono O'OdhamTonganTrinidadian and TobagonianTsimshianTurkishU.S. Virgin IslanderUgandanUkrainianUruguayanUteVenezuelanVietnameseWelshWest IndianYakamaYaquiYugoslavianYumanYup'ikZimbabwean
Immigration
NonimmigrantsImmigrantsAfghanistanAfricaAlbaniaArgentinaArmeniaAsiaAustraliaAustriaBahamasBangladeshBarbadosBelarusBelgiumBelizeBoliviaBosnia and HerzegovinaBrazilBurma/MyanmarCabo VerdeCambodiaCameroonCanadaCaribbeanCentral AmericaChileChinaColombiaCongoCosta RicaCroatiaCubaCzechoslovakiaDenmarkDominicaDominican RepublicEastern AfricaEastern AsiaEastern EuropeEcuadorEgyptEl SalvadorEnglandEritreaEthiopiaEuropeFijiFranceGermanyGhanaGreeceGrenadaGuatemalaGuyanaHaitiHondurasHong KongHungaryIndiaIndonesiaIranIraqIrelandIsraelItalyJamaicaJapanJordanKazakhstanKenyaKoreaKuwaitLaosLatin AmericaLatviaLebanonLiberiaLithuaniaMalaysiaMexicoMicronesiaMiddle AfricaMoldovaMoroccoNepalNetherlandsNicaraguaNigeriaNorth AmericaNorth MacedoniaNorthern AfricaNorthern EuropeNorwayOceaniaPakistanPanamaPeruPhilippinesPolandPortugalRomaniaRussiaSaudi ArabiaScotlandSenegalSerbiaSierra LeoneSingaporeSomaliaSouth AfricaSouth AmericaSouth Central AsiaSouth Eastern AsiaSouthern EuropeSpainSri LankaSt. Vincent and the GrenadinesSudanSwedenSwitzerlandSyriaTaiwanThailandTrinidad and TobagoTurkeyUgandaUkraineUruguayUzbekistanVenezuelaVietnamWest IndiesWestern AfricaWestern AsiaWestern EuropeYemenZaireZimbabweAzores
Immigrants from Bulgaria
Race
Ancestry
AfghanAfricanAlaska NativeAlaskan AthabascanAlbanianAleutAlsatianAmericanApacheArabArapahoArgentineanArmenianAssyrian/Chaldean/SyriacAustralianAustrianBahamianBangladeshiBarbadianBasqueBelgianBelizeanBermudanBhutaneseBlackfeetBolivianBrazilianBritishBritish West IndianBulgarianBurmeseCajunCambodianCanadianCape VerdeanCarpatho RusynCelticCentral AmericanCentral American IndianCherokeeCheyenneChickasawChileanChineseChippewaChoctawColombianColvilleComancheCosta RicanCreeCreekCroatianCrowCubanCypriotCzechCzechoslovakianDanishDelawareDominicanDutchDutch West IndianEastern EuropeanEcuadorianEgyptianEnglishEstonianEthiopianEuropeanFijianFilipinoFinnishFrenchFrench American IndianFrench CanadianGermanGerman RussianGhanaianGreekGuamanian/ChamorroGuatemalanGuyaneseHaitianHonduranHopiHoumaHungarianIcelanderIndian (Asian)IndonesianInupiatIranianIraqiIrishIroquoisIsraeliItalianJamaicanJapaneseJordanianKenyanKiowaKoreanLaotianLatvianLebaneseLiberianLithuanianLumbeeLuxembourgerMacedonianMalaysianMalteseMarshalleseMenomineeMexicanMexican American IndianMongolianMoroccanNative HawaiianNavajoNepaleseNew ZealanderNicaraguanNigerianNorthern EuropeanNorwegianOkinawanOsageOttawaPaiutePakistaniPalestinianPanamanianParaguayanPennsylvania GermanPeruvianPimaPolishPortuguesePotawatomiPuebloPuerto RicanPuget Sound SalishRomanianRussianSalvadoranSamoanScandinavianScotch-IrishScottishSeminoleSenegaleseSerbianShoshoneSierra LeoneanSiouxSlavicSlovakSloveneSomaliSouth AfricanSouth AmericanSouth American IndianSoviet UnionSpaniardSpanishSpanish AmericanSpanish American IndianSri LankanSubsaharan AfricanSudaneseSwedishSwissSyrianTaiwaneseThaiTlingit-HaidaTohono O'OdhamTonganTrinidadian and TobagonianTsimshianTurkishU.S. Virgin IslanderUgandanUkrainianUruguayanUteVenezuelanVietnameseWelshWest IndianYakamaYaquiYugoslavianYumanYup'ikZimbabwean
Immigration
NonimmigrantsImmigrantsAfghanistanAfricaAlbaniaArgentinaArmeniaAsiaAustraliaAustriaBahamasBangladeshBarbadosBelarusBelgiumBelizeBoliviaBosnia and HerzegovinaBrazilBulgariaBurma/MyanmarCabo VerdeCambodiaCameroonCanadaCaribbeanCentral AmericaChileChinaColombiaCongoCosta RicaCroatiaCubaCzechoslovakiaDenmarkDominicaDominican RepublicEastern AfricaEastern AsiaEastern EuropeEcuadorEgyptEl SalvadorEnglandEritreaEthiopiaEuropeFijiFranceGermanyGhanaGreeceGrenadaGuatemalaGuyanaHaitiHondurasHong KongHungaryIndiaIndonesiaIranIraqIrelandIsraelItalyJamaicaJapanJordanKazakhstanKenyaKoreaKuwaitLaosLatin AmericaLatviaLebanonLiberiaLithuaniaMalaysiaMexicoMicronesiaMiddle AfricaMoldovaMoroccoNepalNetherlandsNicaraguaNigeriaNorth AmericaNorth MacedoniaNorthern AfricaNorthern EuropeNorwayOceaniaPakistanPanamaPeruPhilippinesPolandPortugalRomaniaRussiaSaudi ArabiaScotlandSenegalSerbiaSierra LeoneSingaporeSomaliaSouth AfricaSouth AmericaSouth Central AsiaSouth Eastern AsiaSouthern EuropeSpainSri LankaSt. Vincent and the GrenadinesSudanSwedenSwitzerlandSyriaTaiwanThailandTrinidad and TobagoTurkeyUgandaUkraineUruguayUzbekistanVenezuelaVietnamWest IndiesWestern AfricaWestern AsiaWestern EuropeYemenZaireZimbabweAzores
Householder Income Over 65 years
Income
Poverty
Unemployment
Labor Participation
Family Structure
Vehicle Availability
Education Level
Disability

Householder Income Over 65 years Comparison

Hmong

Immigrants from Bulgaria

Tragic
Exceptional
$56,339
HOUSEHOLDER INCOME OVER 65 YEARS
0.8/ 100
METRIC RATING
244th/ 347
METRIC RANK
$64,379
HOUSEHOLDER INCOME OVER 65 YEARS
97.3/ 100
METRIC RATING
92nd/ 347
METRIC RANK

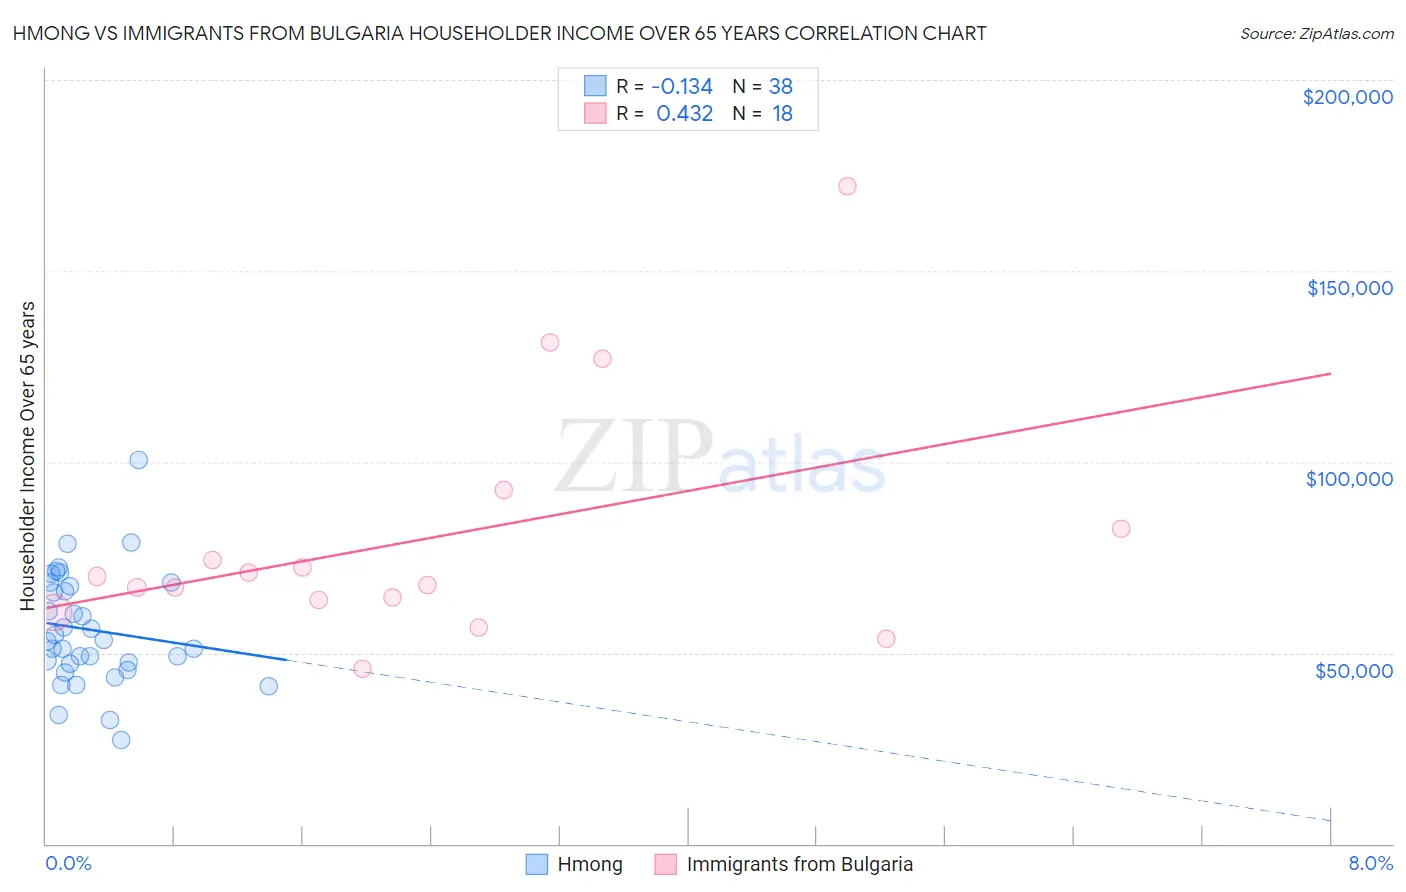
Hmong vs Immigrants from Bulgaria Householder Income Over 65 years Correlation Chart

The statistical analysis conducted on geographies consisting of 24,664,732 people shows a poor negative correlation between the proportion of Hmong and household income with householder over the age of 65 in the United States with a correlation coefficient (R) of -0.134 and weighted average of $56,339. Similarly, the statistical analysis conducted on geographies consisting of 172,418,440 people shows a moderate positive correlation between the proportion of Immigrants from Bulgaria and household income with householder over the age of 65 in the United States with a correlation coefficient (R) of 0.432 and weighted average of $64,379, a difference of 14.3%.
Hmong vs Immigrants from Bulgaria Householder Income Over 65 years

Householder Income Over 65 years Correlation Summary

MeasurementHmongImmigrants from Bulgaria
Minimum$27,125$45,828
Maximum$100,402$172,188
Range$73,277$126,360
Mean$56,016$80,014
Median$53,213$68,903
Interquartile 25% (IQ1)$46,982$63,986
Interquartile 75% (IQ3)$67,354$82,333
Interquartile Range (IQR)$20,372$18,347
Standard Deviation (Sample)$14,666$32,104
Standard Deviation (Population)$14,471$31,200

Similar Demographics by Householder Income Over 65 years

Demographics Similar to Hmong by Householder Income Over 65 years

In terms of householder income over 65 years, the demographic groups most similar to Hmong are Guyanese ($56,351, a difference of 0.020%), Immigrants from Uzbekistan ($56,331, a difference of 0.020%), Central American ($56,321, a difference of 0.030%), Yaqui ($56,417, a difference of 0.14%), and Yakama ($56,234, a difference of 0.19%).
DemographicsRating | RankHouseholder Income Over 65 years
Immigrants | Panama
1.5
/100
|
#237
Tragic
$56,944
Fijians
1.2
/100
|
#238
Tragic
$56,768
Immigrants | Laos
1.2
/100
|
#239
Tragic
$56,722
Sub-Saharan Africans
1.0
/100
|
#240
Tragic
$56,615
Immigrants | Guyana
0.9
/100
|
#241
Tragic
$56,495
Yaqui
0.8
/100
|
#242
Tragic
$56,417
Guyanese
0.8
/100
|
#243
Tragic
$56,351
Hmong
0.8
/100
|
#244
Tragic
$56,339
Immigrants | Uzbekistan
0.8
/100
|
#245
Tragic
$56,331
Central Americans
0.8
/100
|
#246
Tragic
$56,321
Yakama
0.7
/100
|
#247
Tragic
$56,234
Vietnamese
0.6
/100
|
#248
Tragic
$56,143
Mexican American Indians
0.6
/100
|
#249
Tragic
$56,089
Immigrants | Bosnia and Herzegovina
0.5
/100
|
#250
Tragic
$55,986
Immigrants | Portugal
0.5
/100
|
#251
Tragic
$55,924

Demographics Similar to Immigrants from Bulgaria by Householder Income Over 65 years

In terms of householder income over 65 years, the demographic groups most similar to Immigrants from Bulgaria are Immigrants from Oceania ($64,416, a difference of 0.060%), Immigrants from Kuwait ($64,433, a difference of 0.080%), Paraguayan ($64,443, a difference of 0.10%), Jordanian ($64,313, a difference of 0.10%), and Immigrants from Romania ($64,462, a difference of 0.13%).
DemographicsRating | RankHouseholder Income Over 65 years
Immigrants | Lebanon
97.6
/100
|
#85
Exceptional
$64,521
Immigrants | Russia
97.6
/100
|
#86
Exceptional
$64,512
Austrians
97.5
/100
|
#87
Exceptional
$64,470
Immigrants | Romania
97.5
/100
|
#88
Exceptional
$64,462
Paraguayans
97.4
/100
|
#89
Exceptional
$64,443
Immigrants | Kuwait
97.4
/100
|
#90
Exceptional
$64,433
Immigrants | Oceania
97.4
/100
|
#91
Exceptional
$64,416
Immigrants | Bulgaria
97.3
/100
|
#92
Exceptional
$64,379
Jordanians
97.1
/100
|
#93
Exceptional
$64,313
Immigrants | Egypt
97.0
/100
|
#94
Exceptional
$64,299
Immigrants | Latvia
97.0
/100
|
#95
Exceptional
$64,298
Immigrants | Hungary
97.0
/100
|
#96
Exceptional
$64,277
Sri Lankans
96.7
/100
|
#97
Exceptional
$64,201
Romanians
96.5
/100
|
#98
Exceptional
$64,142
Assyrians/Chaldeans/Syriacs
96.4
/100
|
#99
Exceptional
$64,108