Hmong vs West Indian Householder Income Over 65 years
COMPARE
Hmong
West Indian
Householder Income Over 65 years
Householder Income Over 65 years Comparison
Hmong
West Indians
$56,339
HOUSEHOLDER INCOME OVER 65 YEARS
0.8/ 100
METRIC RATING
244th/ 347
METRIC RANK
$54,936
HOUSEHOLDER INCOME OVER 65 YEARS
0.2/ 100
METRIC RATING
259th/ 347
METRIC RANK
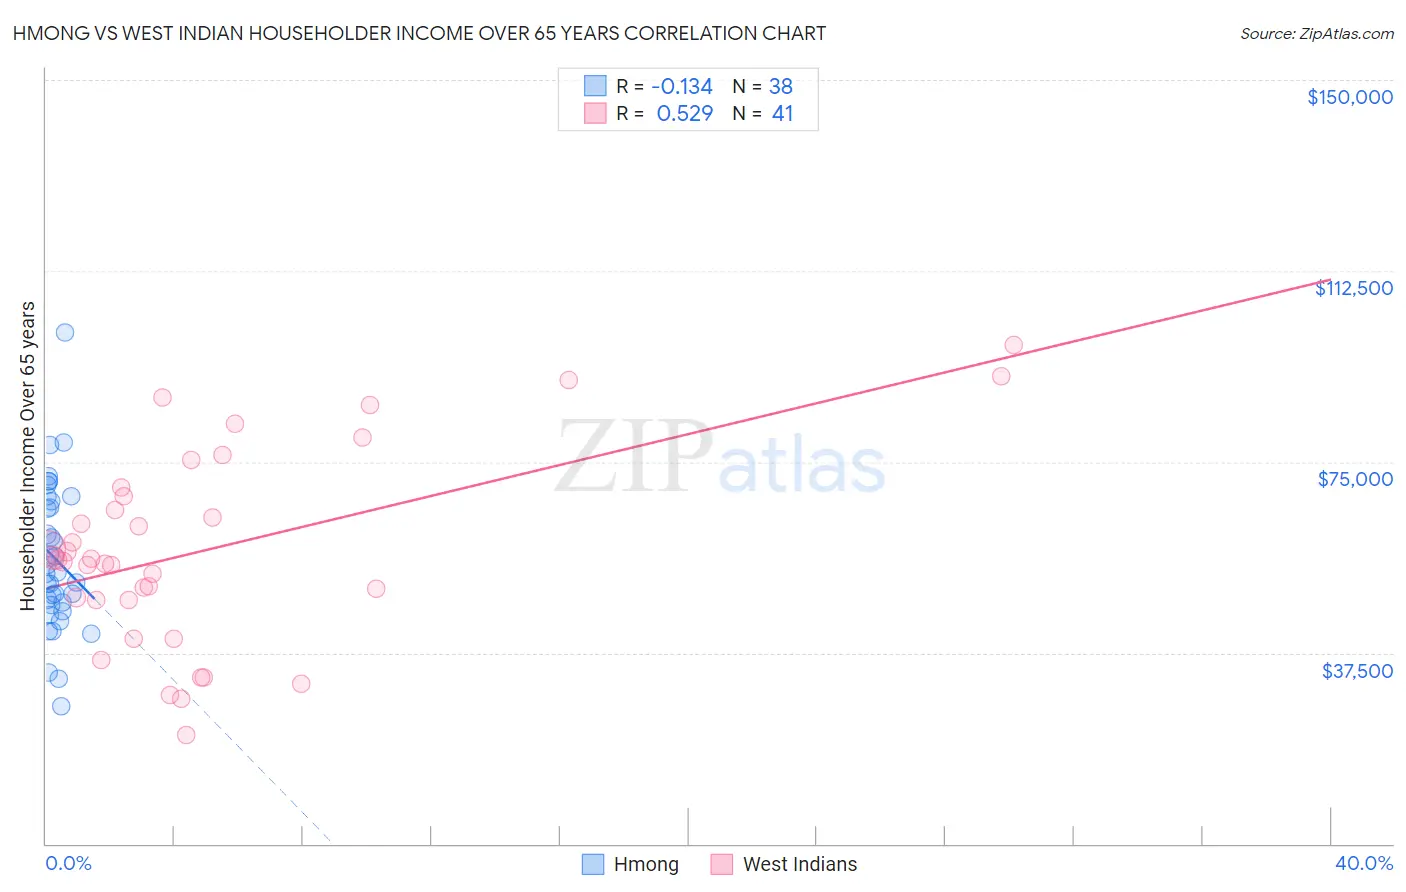
Hmong vs West Indian Householder Income Over 65 years Correlation Chart
The statistical analysis conducted on geographies consisting of 24,664,732 people shows a poor negative correlation between the proportion of Hmong and household income with householder over the age of 65 in the United States with a correlation coefficient (R) of -0.134 and weighted average of $56,339. Similarly, the statistical analysis conducted on geographies consisting of 253,324,861 people shows a substantial positive correlation between the proportion of West Indians and household income with householder over the age of 65 in the United States with a correlation coefficient (R) of 0.529 and weighted average of $54,936, a difference of 2.5%.
Householder Income Over 65 years Correlation Summary
| Measurement | Hmong | West Indian |
| Minimum | $27,125 | $21,368 |
| Maximum | $100,402 | $97,868 |
| Range | $73,277 | $76,500 |
| Mean | $56,016 | $57,688 |
| Median | $53,213 | $55,650 |
| Interquartile 25% (IQ1) | $46,982 | $47,931 |
| Interquartile 75% (IQ3) | $67,354 | $69,062 |
| Interquartile Range (IQR) | $20,372 | $21,132 |
| Standard Deviation (Sample) | $14,666 | $18,888 |
| Standard Deviation (Population) | $14,471 | $18,656 |
Demographics Similar to Hmong and West Indians by Householder Income Over 65 years
In terms of householder income over 65 years, the demographic groups most similar to Hmong are Guyanese ($56,351, a difference of 0.020%), Immigrants from Uzbekistan ($56,331, a difference of 0.020%), Central American ($56,321, a difference of 0.030%), Yaqui ($56,417, a difference of 0.14%), and Yakama ($56,234, a difference of 0.19%). Similarly, the demographic groups most similar to West Indians are Immigrants from West Indies ($54,927, a difference of 0.020%), Comanche ($54,922, a difference of 0.030%), Ecuadorian ($54,958, a difference of 0.040%), Trinidadian and Tobagonian ($55,327, a difference of 0.71%), and German Russian ($55,356, a difference of 0.76%).
| Demographics | Rating | Rank | Householder Income Over 65 years |
| Immigrants | Guyana | 0.9 /100 | #241 | Tragic $56,495 |
| Yaqui | 0.8 /100 | #242 | Tragic $56,417 |
| Guyanese | 0.8 /100 | #243 | Tragic $56,351 |
| Hmong | 0.8 /100 | #244 | Tragic $56,339 |
| Immigrants | Uzbekistan | 0.8 /100 | #245 | Tragic $56,331 |
| Central Americans | 0.8 /100 | #246 | Tragic $56,321 |
| Yakama | 0.7 /100 | #247 | Tragic $56,234 |
| Vietnamese | 0.6 /100 | #248 | Tragic $56,143 |
| Mexican American Indians | 0.6 /100 | #249 | Tragic $56,089 |
| Immigrants | Bosnia and Herzegovina | 0.5 /100 | #250 | Tragic $55,986 |
| Immigrants | Portugal | 0.5 /100 | #251 | Tragic $55,924 |
| Osage | 0.4 /100 | #252 | Tragic $55,677 |
| Immigrants | Trinidad and Tobago | 0.4 /100 | #253 | Tragic $55,598 |
| Americans | 0.3 /100 | #254 | Tragic $55,527 |
| Immigrants | Bangladesh | 0.3 /100 | #255 | Tragic $55,394 |
| German Russians | 0.3 /100 | #256 | Tragic $55,356 |
| Trinidadians and Tobagonians | 0.3 /100 | #257 | Tragic $55,327 |
| Ecuadorians | 0.2 /100 | #258 | Tragic $54,958 |
| West Indians | 0.2 /100 | #259 | Tragic $54,936 |
| Immigrants | West Indies | 0.2 /100 | #260 | Tragic $54,927 |
| Comanche | 0.2 /100 | #261 | Tragic $54,922 |