Hmong vs Chickasaw Single Mother Households
COMPARE
Hmong
Chickasaw
Single Mother Households
Single Mother Households Comparison
Hmong
Chickasaw
6.4%
SINGLE MOTHER HOUSEHOLDS
39.8/ 100
METRIC RATING
179th/ 347
METRIC RANK
7.0%
SINGLE MOTHER HOUSEHOLDS
1.4/ 100
METRIC RATING
234th/ 347
METRIC RANK
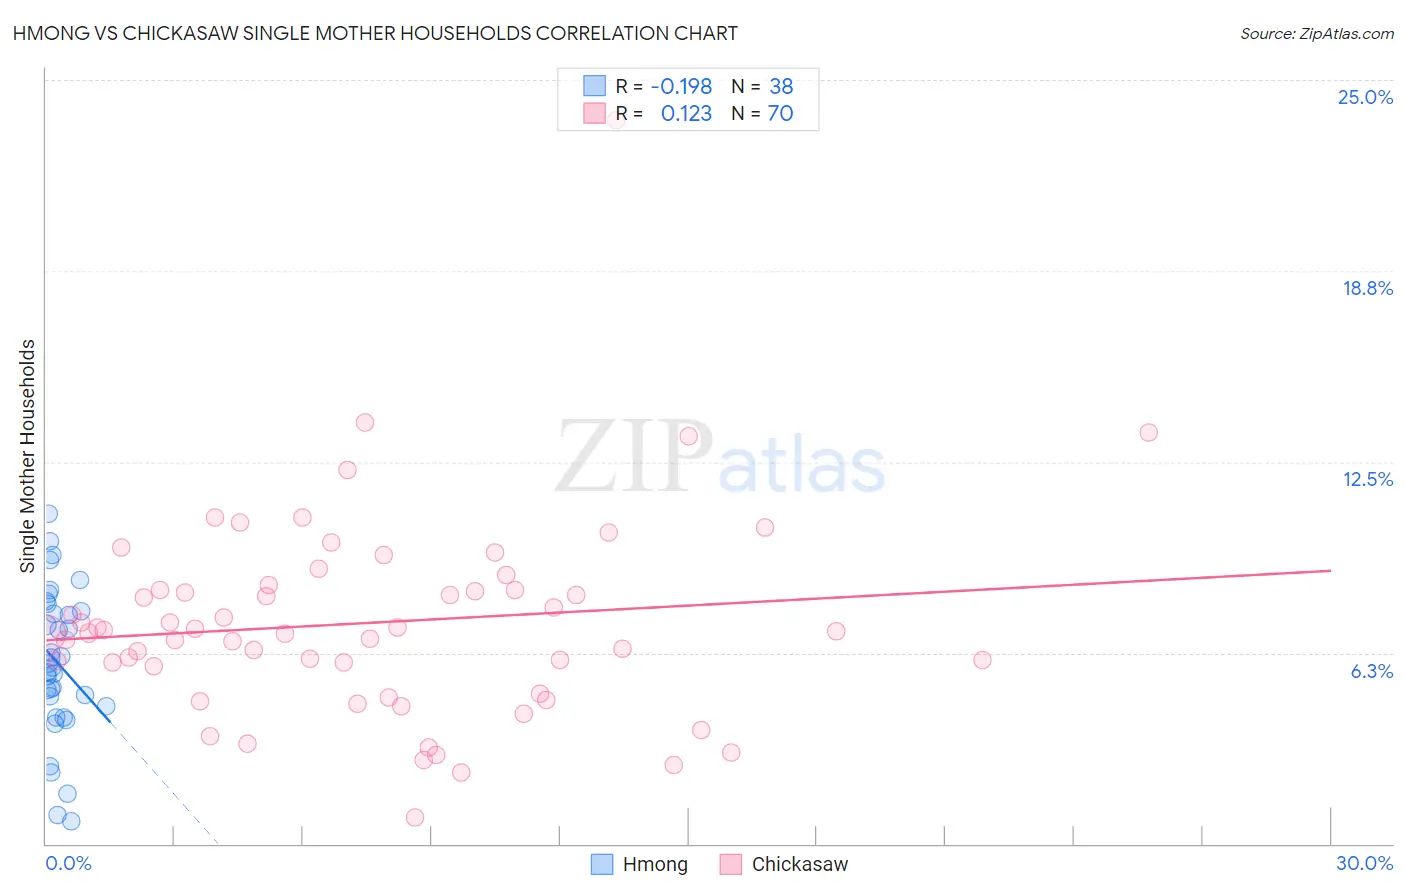
Hmong vs Chickasaw Single Mother Households Correlation Chart
The statistical analysis conducted on geographies consisting of 24,669,739 people shows a poor negative correlation between the proportion of Hmong and percentage of single mother households in the United States with a correlation coefficient (R) of -0.198 and weighted average of 6.4%. Similarly, the statistical analysis conducted on geographies consisting of 147,547,774 people shows a poor positive correlation between the proportion of Chickasaw and percentage of single mother households in the United States with a correlation coefficient (R) of 0.123 and weighted average of 7.0%, a difference of 10.4%.
Single Mother Households Correlation Summary
| Measurement | Hmong | Chickasaw |
| Minimum | 0.72% | 0.84% |
| Maximum | 10.8% | 23.7% |
| Range | 10.1% | 22.8% |
| Mean | 5.9% | 7.2% |
| Median | 5.8% | 6.9% |
| Interquartile 25% (IQ1) | 4.5% | 5.8% |
| Interquartile 75% (IQ3) | 7.6% | 8.3% |
| Interquartile Range (IQR) | 3.1% | 2.5% |
| Standard Deviation (Sample) | 2.4% | 3.3% |
| Standard Deviation (Population) | 2.4% | 3.3% |
Similar Demographics by Single Mother Households
Demographics Similar to Hmong by Single Mother Households
In terms of single mother households, the demographic groups most similar to Hmong are Portuguese (6.4%, a difference of 0.020%), Osage (6.4%, a difference of 0.36%), Immigrants from Nepal (6.4%, a difference of 0.43%), Immigrants from Bosnia and Herzegovina (6.3%, a difference of 0.51%), and Marshallese (6.3%, a difference of 0.67%).
| Demographics | Rating | Rank | Single Mother Households |
| Immigrants | South Eastern Asia | 52.2 /100 | #172 | Average 6.3% |
| Immigrants | Vietnam | 51.5 /100 | #173 | Average 6.3% |
| Immigrants | Morocco | 50.0 /100 | #174 | Average 6.3% |
| Marshallese | 45.8 /100 | #175 | Average 6.3% |
| Immigrants | Bosnia and Herzegovina | 44.3 /100 | #176 | Average 6.3% |
| Osage | 43.0 /100 | #177 | Average 6.4% |
| Portuguese | 40.0 /100 | #178 | Fair 6.4% |
| Hmong | 39.8 /100 | #179 | Fair 6.4% |
| Immigrants | Nepal | 36.1 /100 | #180 | Fair 6.4% |
| Spanish | 33.4 /100 | #181 | Fair 6.4% |
| South American Indians | 33.4 /100 | #182 | Fair 6.4% |
| Spaniards | 27.8 /100 | #183 | Fair 6.5% |
| Ethiopians | 26.0 /100 | #184 | Fair 6.5% |
| Ugandans | 25.6 /100 | #185 | Fair 6.5% |
| Costa Ricans | 24.8 /100 | #186 | Fair 6.5% |
Demographics Similar to Chickasaw by Single Mother Households
In terms of single mother households, the demographic groups most similar to Chickasaw are Choctaw (7.0%, a difference of 0.020%), Immigrants from Burma/Myanmar (7.0%, a difference of 0.070%), Comanche (7.0%, a difference of 0.19%), Spanish American (7.0%, a difference of 0.25%), and Creek (7.0%, a difference of 0.27%).
| Demographics | Rating | Rank | Single Mother Households |
| Kenyans | 2.3 /100 | #227 | Tragic 7.0% |
| Iroquois | 2.2 /100 | #228 | Tragic 7.0% |
| Immigrants | Kenya | 2.1 /100 | #229 | Tragic 7.0% |
| Creek | 1.6 /100 | #230 | Tragic 7.0% |
| Spanish Americans | 1.6 /100 | #231 | Tragic 7.0% |
| Comanche | 1.5 /100 | #232 | Tragic 7.0% |
| Choctaw | 1.4 /100 | #233 | Tragic 7.0% |
| Chickasaw | 1.4 /100 | #234 | Tragic 7.0% |
| Immigrants | Burma/Myanmar | 1.4 /100 | #235 | Tragic 7.0% |
| Ute | 1.0 /100 | #236 | Tragic 7.1% |
| Arapaho | 1.0 /100 | #237 | Tragic 7.1% |
| Panamanians | 0.9 /100 | #238 | Tragic 7.1% |
| Kiowa | 0.8 /100 | #239 | Tragic 7.1% |
| Immigrants | Panama | 0.7 /100 | #240 | Tragic 7.2% |
| Immigrants | Portugal | 0.6 /100 | #241 | Tragic 7.2% |