Guamanian/Chamorro vs Moroccan Wage/Income Gap
COMPARE
Guamanian/Chamorro
Moroccan
Wage/Income Gap
Wage/Income Gap Comparison
Guamanians/Chamorros
Moroccans
26.0%
WAGE/INCOME GAP
38.0/ 100
METRIC RATING
180th/ 347
METRIC RANK
24.0%
WAGE/INCOME GAP
98.6/ 100
METRIC RATING
105th/ 347
METRIC RANK
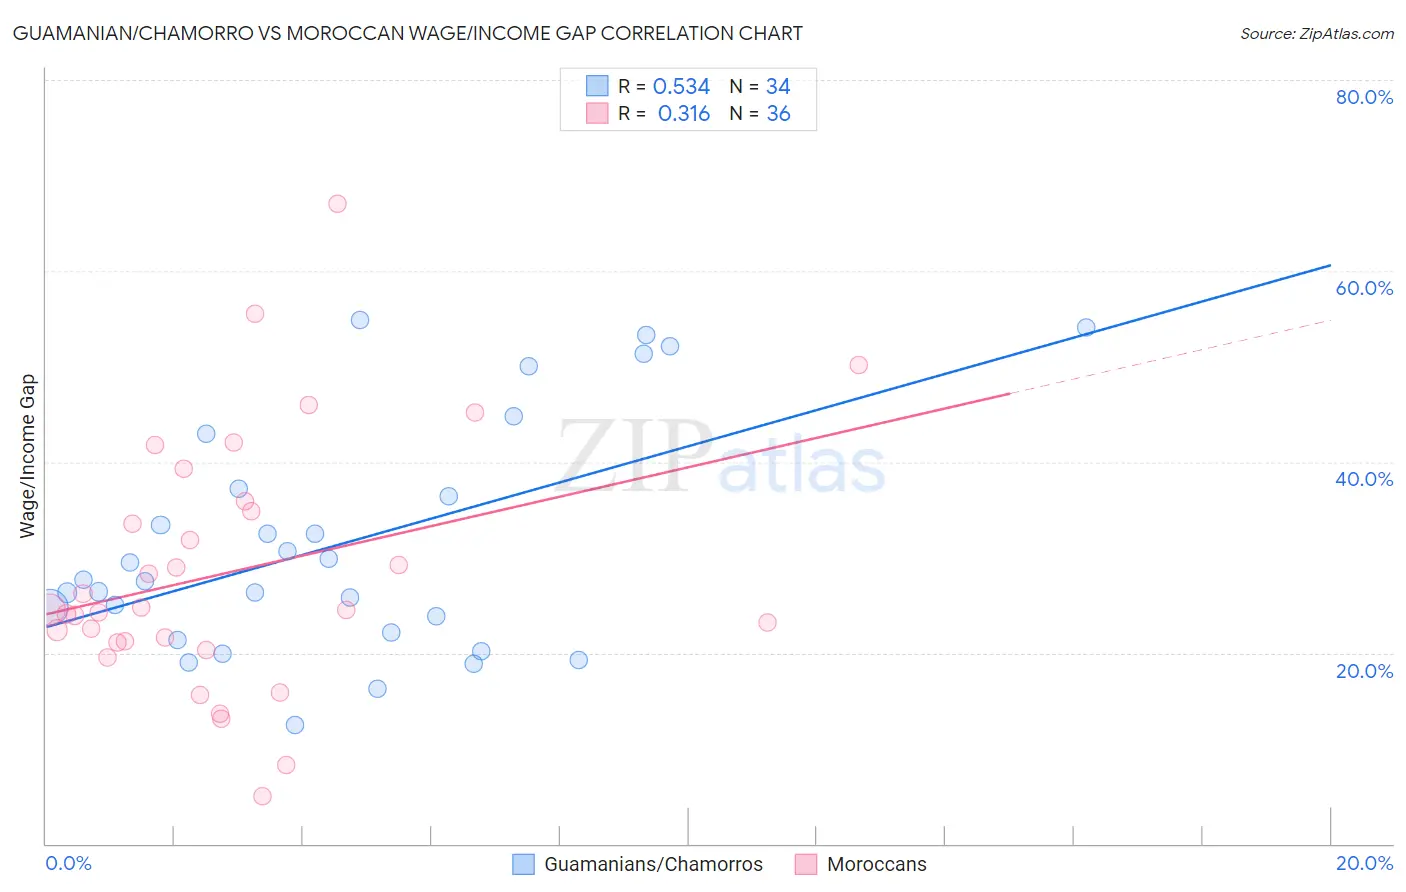
Guamanian/Chamorro vs Moroccan Wage/Income Gap Correlation Chart
The statistical analysis conducted on geographies consisting of 221,896,137 people shows a substantial positive correlation between the proportion of Guamanians/Chamorros and wage/income gap percentage in the United States with a correlation coefficient (R) of 0.534 and weighted average of 26.0%. Similarly, the statistical analysis conducted on geographies consisting of 201,754,840 people shows a mild positive correlation between the proportion of Moroccans and wage/income gap percentage in the United States with a correlation coefficient (R) of 0.316 and weighted average of 24.0%, a difference of 8.4%.
Wage/Income Gap Correlation Summary
| Measurement | Guamanian/Chamorro | Moroccan |
| Minimum | 12.5% | 4.9% |
| Maximum | 54.9% | 67.0% |
| Range | 42.4% | 62.1% |
| Mean | 31.4% | 28.5% |
| Median | 27.5% | 24.5% |
| Interquartile 25% (IQ1) | 22.2% | 21.2% |
| Interquartile 75% (IQ3) | 37.2% | 35.4% |
| Interquartile Range (IQR) | 15.1% | 14.2% |
| Standard Deviation (Sample) | 12.1% | 13.2% |
| Standard Deviation (Population) | 12.0% | 13.1% |
Similar Demographics by Wage/Income Gap
Demographics Similar to Guamanians/Chamorros by Wage/Income Gap
In terms of wage/income gap, the demographic groups most similar to Guamanians/Chamorros are Samoan (26.0%, a difference of 0.040%), Immigrants from Bolivia (26.0%, a difference of 0.11%), Immigrants from Serbia (26.0%, a difference of 0.19%), Immigrants from Kazakhstan (26.0%, a difference of 0.20%), and Mexican (26.0%, a difference of 0.26%).
| Demographics | Rating | Rank | Wage/Income Gap |
| Immigrants | Belarus | 52.9 /100 | #173 | Average 25.7% |
| Alaskan Athabascans | 50.0 /100 | #174 | Average 25.8% |
| Sri Lankans | 47.0 /100 | #175 | Average 25.8% |
| Paraguayans | 46.7 /100 | #176 | Average 25.8% |
| Cambodians | 45.1 /100 | #177 | Average 25.8% |
| Chinese | 42.0 /100 | #178 | Average 25.9% |
| Samoans | 38.6 /100 | #179 | Fair 26.0% |
| Guamanians/Chamorros | 38.0 /100 | #180 | Fair 26.0% |
| Immigrants | Bolivia | 36.4 /100 | #181 | Fair 26.0% |
| Immigrants | Serbia | 35.4 /100 | #182 | Fair 26.0% |
| Immigrants | Kazakhstan | 35.2 /100 | #183 | Fair 26.0% |
| Mexicans | 34.4 /100 | #184 | Fair 26.0% |
| Pakistanis | 33.7 /100 | #185 | Fair 26.1% |
| Immigrants | Indonesia | 32.5 /100 | #186 | Fair 26.1% |
| Palestinians | 29.9 /100 | #187 | Fair 26.1% |
Demographics Similar to Moroccans by Wage/Income Gap
In terms of wage/income gap, the demographic groups most similar to Moroccans are Sudanese (24.0%, a difference of 0.0%), Tlingit-Haida (24.0%, a difference of 0.060%), Yaqui (24.0%, a difference of 0.31%), Immigrants from Albania (24.0%, a difference of 0.31%), and Ugandan (24.1%, a difference of 0.37%).
| Demographics | Rating | Rank | Wage/Income Gap |
| Immigrants | Latin America | 99.2 /100 | #98 | Exceptional 23.7% |
| Aleuts | 99.2 /100 | #99 | Exceptional 23.7% |
| Yakama | 99.2 /100 | #100 | Exceptional 23.7% |
| Japanese | 99.1 /100 | #101 | Exceptional 23.8% |
| Immigrants | Laos | 99.0 /100 | #102 | Exceptional 23.8% |
| Tsimshian | 98.9 /100 | #103 | Exceptional 23.9% |
| Tlingit-Haida | 98.7 /100 | #104 | Exceptional 24.0% |
| Moroccans | 98.6 /100 | #105 | Exceptional 24.0% |
| Sudanese | 98.6 /100 | #106 | Exceptional 24.0% |
| Yaqui | 98.4 /100 | #107 | Exceptional 24.0% |
| Immigrants | Albania | 98.4 /100 | #108 | Exceptional 24.0% |
| Ugandans | 98.3 /100 | #109 | Exceptional 24.1% |
| Immigrants | Morocco | 98.1 /100 | #110 | Exceptional 24.1% |
| Soviet Union | 97.6 /100 | #111 | Exceptional 24.2% |
| Immigrants | Colombia | 97.0 /100 | #112 | Exceptional 24.3% |