Guamanian/Chamorro vs South African Wage/Income Gap
COMPARE
Guamanian/Chamorro
South African
Wage/Income Gap
Wage/Income Gap Comparison
Guamanians/Chamorros
South Africans
26.0%
WAGE/INCOME GAP
38.0/ 100
METRIC RATING
180th/ 347
METRIC RANK
28.0%
WAGE/INCOME GAP
0.5/ 100
METRIC RATING
282nd/ 347
METRIC RANK
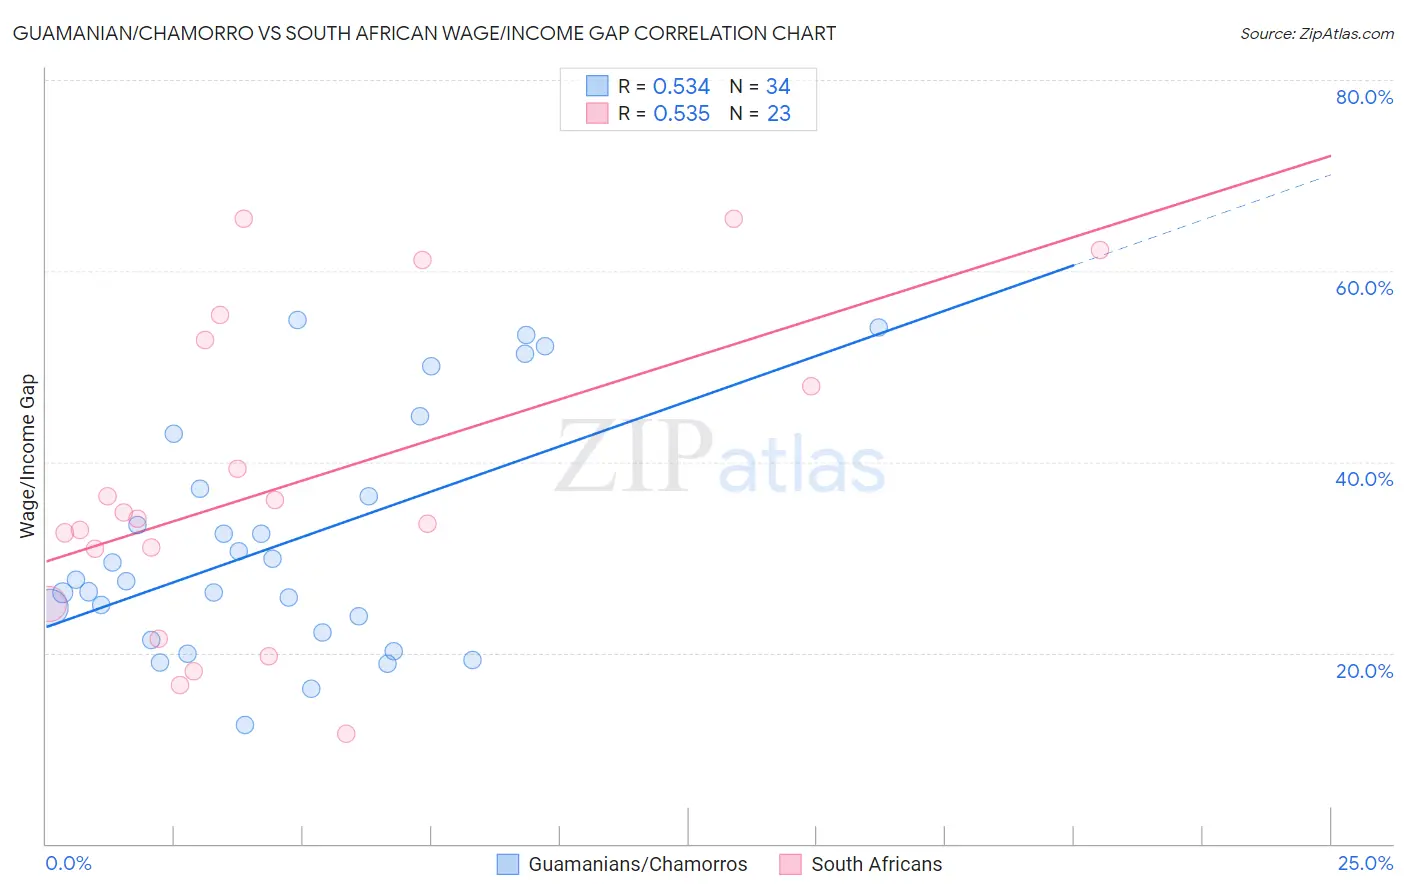
Guamanian/Chamorro vs South African Wage/Income Gap Correlation Chart
The statistical analysis conducted on geographies consisting of 221,896,137 people shows a substantial positive correlation between the proportion of Guamanians/Chamorros and wage/income gap percentage in the United States with a correlation coefficient (R) of 0.534 and weighted average of 26.0%. Similarly, the statistical analysis conducted on geographies consisting of 182,544,146 people shows a substantial positive correlation between the proportion of South Africans and wage/income gap percentage in the United States with a correlation coefficient (R) of 0.535 and weighted average of 28.0%, a difference of 7.9%.
Wage/Income Gap Correlation Summary
| Measurement | Guamanian/Chamorro | South African |
| Minimum | 12.5% | 11.5% |
| Maximum | 54.9% | 65.5% |
| Range | 42.4% | 54.0% |
| Mean | 31.4% | 37.6% |
| Median | 27.5% | 34.0% |
| Interquartile 25% (IQ1) | 22.2% | 25.1% |
| Interquartile 75% (IQ3) | 37.2% | 52.7% |
| Interquartile Range (IQR) | 15.1% | 27.6% |
| Standard Deviation (Sample) | 12.1% | 16.2% |
| Standard Deviation (Population) | 12.0% | 15.9% |
Similar Demographics by Wage/Income Gap
Demographics Similar to Guamanians/Chamorros by Wage/Income Gap
In terms of wage/income gap, the demographic groups most similar to Guamanians/Chamorros are Samoan (26.0%, a difference of 0.040%), Immigrants from Bolivia (26.0%, a difference of 0.11%), Immigrants from Serbia (26.0%, a difference of 0.19%), Immigrants from Kazakhstan (26.0%, a difference of 0.20%), and Mexican (26.0%, a difference of 0.26%).
| Demographics | Rating | Rank | Wage/Income Gap |
| Immigrants | Belarus | 52.9 /100 | #173 | Average 25.7% |
| Alaskan Athabascans | 50.0 /100 | #174 | Average 25.8% |
| Sri Lankans | 47.0 /100 | #175 | Average 25.8% |
| Paraguayans | 46.7 /100 | #176 | Average 25.8% |
| Cambodians | 45.1 /100 | #177 | Average 25.8% |
| Chinese | 42.0 /100 | #178 | Average 25.9% |
| Samoans | 38.6 /100 | #179 | Fair 26.0% |
| Guamanians/Chamorros | 38.0 /100 | #180 | Fair 26.0% |
| Immigrants | Bolivia | 36.4 /100 | #181 | Fair 26.0% |
| Immigrants | Serbia | 35.4 /100 | #182 | Fair 26.0% |
| Immigrants | Kazakhstan | 35.2 /100 | #183 | Fair 26.0% |
| Mexicans | 34.4 /100 | #184 | Fair 26.0% |
| Pakistanis | 33.7 /100 | #185 | Fair 26.1% |
| Immigrants | Indonesia | 32.5 /100 | #186 | Fair 26.1% |
| Palestinians | 29.9 /100 | #187 | Fair 26.1% |
Demographics Similar to South Africans by Wage/Income Gap
In terms of wage/income gap, the demographic groups most similar to South Africans are Burmese (28.0%, a difference of 0.030%), Russian (28.0%, a difference of 0.080%), French Canadian (28.1%, a difference of 0.18%), Immigrants from Sweden (28.1%, a difference of 0.18%), and Romanian (28.0%, a difference of 0.23%).
| Demographics | Rating | Rank | Wage/Income Gap |
| Immigrants | Japan | 0.7 /100 | #275 | Tragic 27.9% |
| Lebanese | 0.7 /100 | #276 | Tragic 27.9% |
| Latvians | 0.7 /100 | #277 | Tragic 27.9% |
| Immigrants | England | 0.6 /100 | #278 | Tragic 27.9% |
| Romanians | 0.5 /100 | #279 | Tragic 28.0% |
| Russians | 0.5 /100 | #280 | Tragic 28.0% |
| Burmese | 0.5 /100 | #281 | Tragic 28.0% |
| South Africans | 0.5 /100 | #282 | Tragic 28.0% |
| French Canadians | 0.4 /100 | #283 | Tragic 28.1% |
| Immigrants | Sweden | 0.4 /100 | #284 | Tragic 28.1% |
| Italians | 0.4 /100 | #285 | Tragic 28.1% |
| Immigrants | Austria | 0.4 /100 | #286 | Tragic 28.1% |
| Okinawans | 0.4 /100 | #287 | Tragic 28.1% |
| Choctaw | 0.4 /100 | #288 | Tragic 28.1% |
| Canadians | 0.3 /100 | #289 | Tragic 28.1% |