German vs Romanian Wage/Income Gap
COMPARE
German
Romanian
Wage/Income Gap
Wage/Income Gap Comparison
Germans
Romanians
29.2%
WAGE/INCOME GAP
0.0/ 100
METRIC RATING
330th/ 347
METRIC RANK
28.0%
WAGE/INCOME GAP
0.5/ 100
METRIC RATING
279th/ 347
METRIC RANK
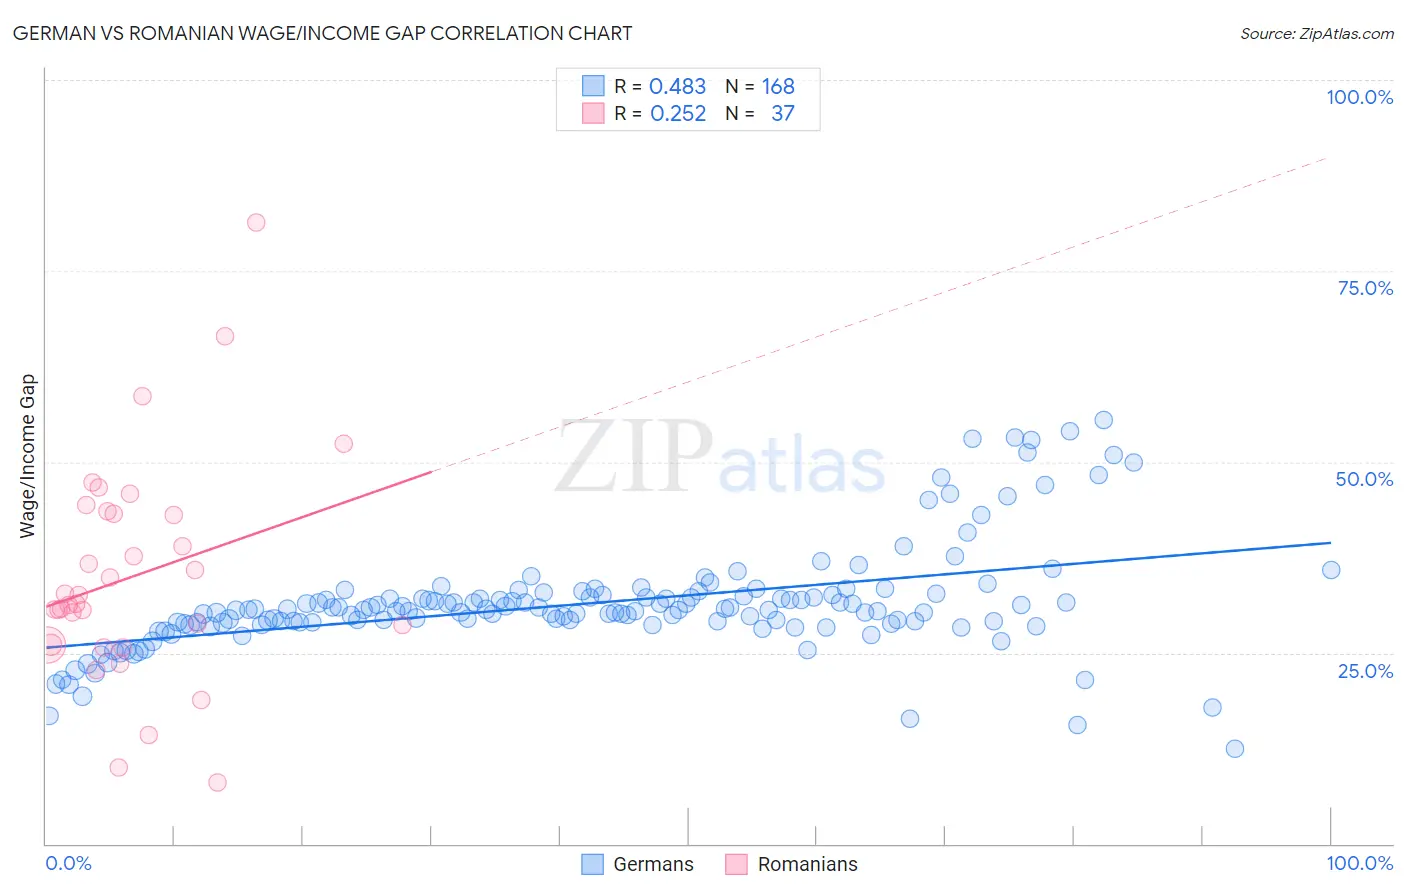
German vs Romanian Wage/Income Gap Correlation Chart
The statistical analysis conducted on geographies consisting of 576,849,006 people shows a moderate positive correlation between the proportion of Germans and wage/income gap percentage in the United States with a correlation coefficient (R) of 0.483 and weighted average of 29.2%. Similarly, the statistical analysis conducted on geographies consisting of 377,662,132 people shows a weak positive correlation between the proportion of Romanians and wage/income gap percentage in the United States with a correlation coefficient (R) of 0.252 and weighted average of 28.0%, a difference of 4.3%.
Wage/Income Gap Correlation Summary
| Measurement | German | Romanian |
| Minimum | 12.4% | 8.0% |
| Maximum | 55.5% | 81.4% |
| Range | 43.0% | 73.3% |
| Mean | 31.5% | 35.0% |
| Median | 30.6% | 31.4% |
| Interquartile 25% (IQ1) | 29.0% | 26.0% |
| Interquartile 75% (IQ3) | 32.3% | 43.4% |
| Interquartile Range (IQR) | 3.3% | 17.3% |
| Standard Deviation (Sample) | 7.0% | 14.5% |
| Standard Deviation (Population) | 7.0% | 14.3% |
Similar Demographics by Wage/Income Gap
Demographics Similar to Germans by Wage/Income Gap
In terms of wage/income gap, the demographic groups most similar to Germans are Czech (29.2%, a difference of 0.050%), Scottish (29.1%, a difference of 0.10%), Scandinavian (29.1%, a difference of 0.24%), Immigrants from Iran (29.1%, a difference of 0.30%), and Immigrants from Belgium (29.0%, a difference of 0.41%).
| Demographics | Rating | Rank | Wage/Income Gap |
| Norwegians | 0.1 /100 | #323 | Tragic 29.0% |
| Croatians | 0.0 /100 | #324 | Tragic 29.0% |
| Hungarians | 0.0 /100 | #325 | Tragic 29.0% |
| Immigrants | Belgium | 0.0 /100 | #326 | Tragic 29.0% |
| Immigrants | Iran | 0.0 /100 | #327 | Tragic 29.1% |
| Scandinavians | 0.0 /100 | #328 | Tragic 29.1% |
| Scottish | 0.0 /100 | #329 | Tragic 29.1% |
| Germans | 0.0 /100 | #330 | Tragic 29.2% |
| Czechs | 0.0 /100 | #331 | Tragic 29.2% |
| Immigrants | South Central Asia | 0.0 /100 | #332 | Tragic 29.3% |
| Europeans | 0.0 /100 | #333 | Tragic 29.4% |
| Swedes | 0.0 /100 | #334 | Tragic 29.4% |
| Immigrants | Taiwan | 0.0 /100 | #335 | Tragic 29.5% |
| English | 0.0 /100 | #336 | Tragic 29.5% |
| Dutch | 0.0 /100 | #337 | Tragic 29.6% |
Demographics Similar to Romanians by Wage/Income Gap
In terms of wage/income gap, the demographic groups most similar to Romanians are Russian (28.0%, a difference of 0.15%), Burmese (28.0%, a difference of 0.20%), Immigrants from England (27.9%, a difference of 0.23%), South African (28.0%, a difference of 0.23%), and Lebanese (27.9%, a difference of 0.31%).
| Demographics | Rating | Rank | Wage/Income Gap |
| Immigrants | Korea | 0.8 /100 | #272 | Tragic 27.8% |
| Bulgarians | 0.7 /100 | #273 | Tragic 27.8% |
| Americans | 0.7 /100 | #274 | Tragic 27.8% |
| Immigrants | Japan | 0.7 /100 | #275 | Tragic 27.9% |
| Lebanese | 0.7 /100 | #276 | Tragic 27.9% |
| Latvians | 0.7 /100 | #277 | Tragic 27.9% |
| Immigrants | England | 0.6 /100 | #278 | Tragic 27.9% |
| Romanians | 0.5 /100 | #279 | Tragic 28.0% |
| Russians | 0.5 /100 | #280 | Tragic 28.0% |
| Burmese | 0.5 /100 | #281 | Tragic 28.0% |
| South Africans | 0.5 /100 | #282 | Tragic 28.0% |
| French Canadians | 0.4 /100 | #283 | Tragic 28.1% |
| Immigrants | Sweden | 0.4 /100 | #284 | Tragic 28.1% |
| Italians | 0.4 /100 | #285 | Tragic 28.1% |
| Immigrants | Austria | 0.4 /100 | #286 | Tragic 28.1% |