Afghan vs Immigrants from Sudan Median Family Income
COMPARE
Afghan
Immigrants from Sudan
Median Family Income
Median Family Income Comparison
Afghans
Immigrants from Sudan
$112,971
MEDIAN FAMILY INCOME
99.5/ 100
METRIC RATING
72nd/ 347
METRIC RANK
$97,737
MEDIAN FAMILY INCOME
7.4/ 100
METRIC RATING
211th/ 347
METRIC RANK
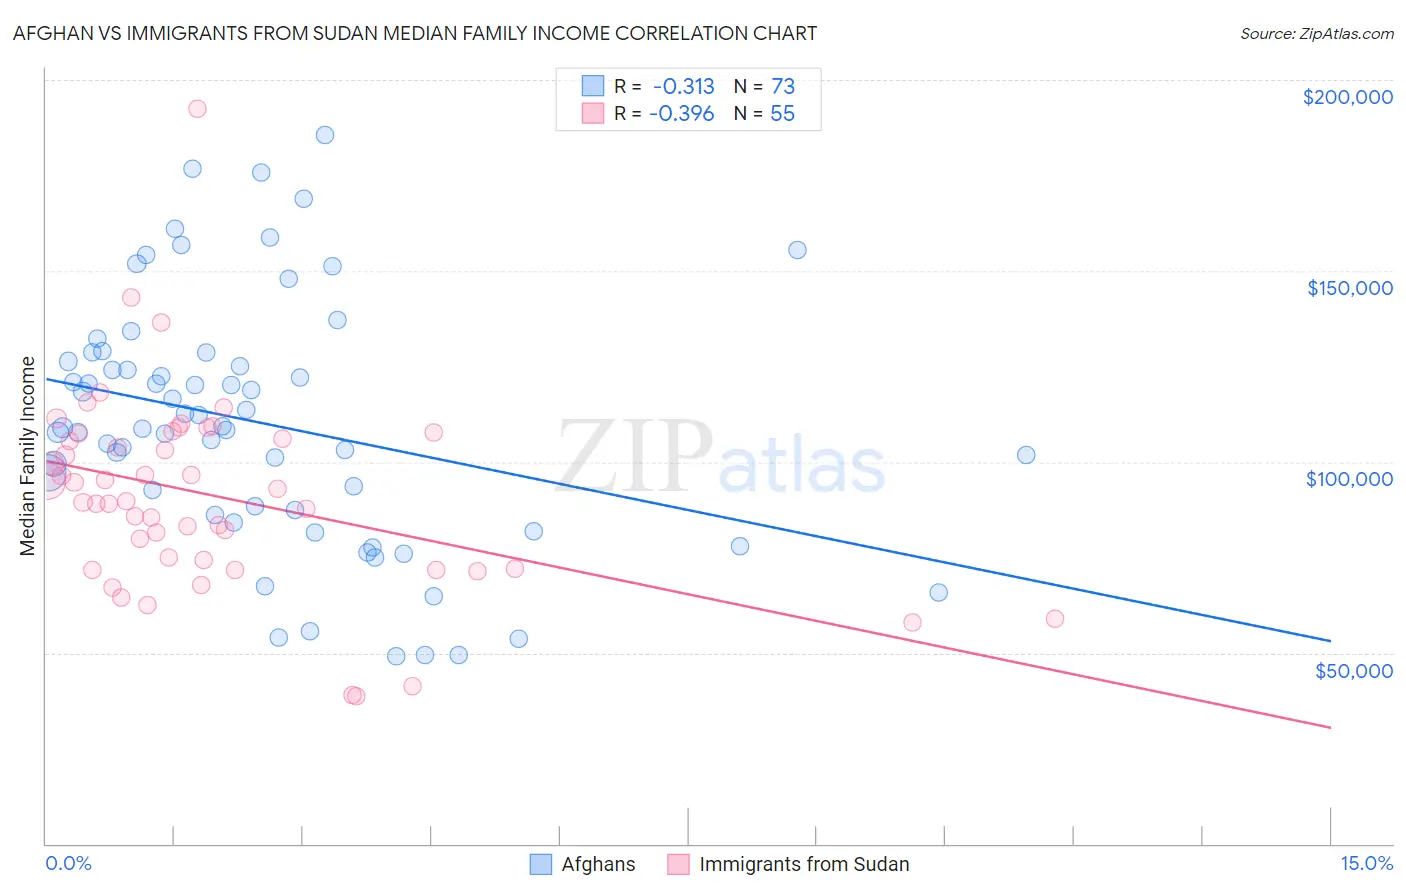
Afghan vs Immigrants from Sudan Median Family Income Correlation Chart
The statistical analysis conducted on geographies consisting of 148,816,167 people shows a mild negative correlation between the proportion of Afghans and median family income in the United States with a correlation coefficient (R) of -0.313 and weighted average of $112,971. Similarly, the statistical analysis conducted on geographies consisting of 118,933,940 people shows a mild negative correlation between the proportion of Immigrants from Sudan and median family income in the United States with a correlation coefficient (R) of -0.396 and weighted average of $97,737, a difference of 15.6%.
Median Family Income Correlation Summary
| Measurement | Afghan | Immigrants from Sudan |
| Minimum | $49,167 | $38,705 |
| Maximum | $185,438 | $192,500 |
| Range | $136,271 | $153,795 |
| Mean | $110,128 | $91,079 |
| Median | $108,924 | $89,618 |
| Interquartile 25% (IQ1) | $86,729 | $71,964 |
| Interquartile 75% (IQ3) | $127,419 | $107,289 |
| Interquartile Range (IQR) | $40,689 | $35,325 |
| Standard Deviation (Sample) | $32,416 | $25,898 |
| Standard Deviation (Population) | $32,193 | $25,661 |
Similar Demographics by Median Family Income
Demographics Similar to Afghans by Median Family Income
In terms of median family income, the demographic groups most similar to Afghans are Laotian ($112,859, a difference of 0.10%), Immigrants from Italy ($112,848, a difference of 0.11%), South African ($113,229, a difference of 0.23%), Immigrants from Western Europe ($112,688, a difference of 0.25%), and Argentinean ($112,665, a difference of 0.27%).
| Demographics | Rating | Rank | Median Family Income |
| Egyptians | 99.7 /100 | #65 | Exceptional $114,119 |
| Paraguayans | 99.7 /100 | #66 | Exceptional $114,016 |
| Immigrants | Spain | 99.7 /100 | #67 | Exceptional $113,815 |
| Immigrants | Serbia | 99.6 /100 | #68 | Exceptional $113,463 |
| Immigrants | Bulgaria | 99.6 /100 | #69 | Exceptional $113,461 |
| Immigrants | Romania | 99.6 /100 | #70 | Exceptional $113,434 |
| South Africans | 99.5 /100 | #71 | Exceptional $113,229 |
| Afghans | 99.5 /100 | #72 | Exceptional $112,971 |
| Laotians | 99.5 /100 | #73 | Exceptional $112,859 |
| Immigrants | Italy | 99.4 /100 | #74 | Exceptional $112,848 |
| Immigrants | Western Europe | 99.4 /100 | #75 | Exceptional $112,688 |
| Argentineans | 99.4 /100 | #76 | Exceptional $112,665 |
| Immigrants | Eastern Europe | 99.4 /100 | #77 | Exceptional $112,527 |
| Immigrants | Canada | 99.3 /100 | #78 | Exceptional $112,374 |
| Italians | 99.3 /100 | #79 | Exceptional $112,372 |
Demographics Similar to Immigrants from Sudan by Median Family Income
In terms of median family income, the demographic groups most similar to Immigrants from Sudan are Panamanian ($97,683, a difference of 0.050%), Immigrants from Armenia ($97,605, a difference of 0.13%), Bermudan ($97,577, a difference of 0.16%), Nigerian ($97,522, a difference of 0.22%), and Puget Sound Salish ($97,958, a difference of 0.23%).
| Demographics | Rating | Rank | Median Family Income |
| Ghanaians | 12.6 /100 | #204 | Poor $98,877 |
| Hawaiians | 12.5 /100 | #205 | Poor $98,869 |
| Immigrants | Iraq | 12.1 /100 | #206 | Poor $98,786 |
| Aleuts | 11.6 /100 | #207 | Poor $98,702 |
| Immigrants | Uruguay | 9.2 /100 | #208 | Tragic $98,205 |
| Immigrants | Colombia | 8.7 /100 | #209 | Tragic $98,067 |
| Puget Sound Salish | 8.2 /100 | #210 | Tragic $97,958 |
| Immigrants | Sudan | 7.4 /100 | #211 | Tragic $97,737 |
| Panamanians | 7.2 /100 | #212 | Tragic $97,683 |
| Immigrants | Armenia | 7.0 /100 | #213 | Tragic $97,605 |
| Bermudans | 6.9 /100 | #214 | Tragic $97,577 |
| Nigerians | 6.7 /100 | #215 | Tragic $97,522 |
| Immigrants | Bosnia and Herzegovina | 6.4 /100 | #216 | Tragic $97,432 |
| Japanese | 6.0 /100 | #217 | Tragic $97,288 |
| Immigrants | Cambodia | 5.8 /100 | #218 | Tragic $97,222 |