Finnish vs Immigrants from Middle Africa Median Family Income
COMPARE
Finnish
Immigrants from Middle Africa
Median Family Income
Median Family Income Comparison
Finns
Immigrants from Middle Africa
$102,676
MEDIAN FAMILY INCOME
50.0/ 100
METRIC RATING
174th/ 347
METRIC RANK
$93,593
MEDIAN FAMILY INCOME
1.0/ 100
METRIC RATING
245th/ 347
METRIC RANK
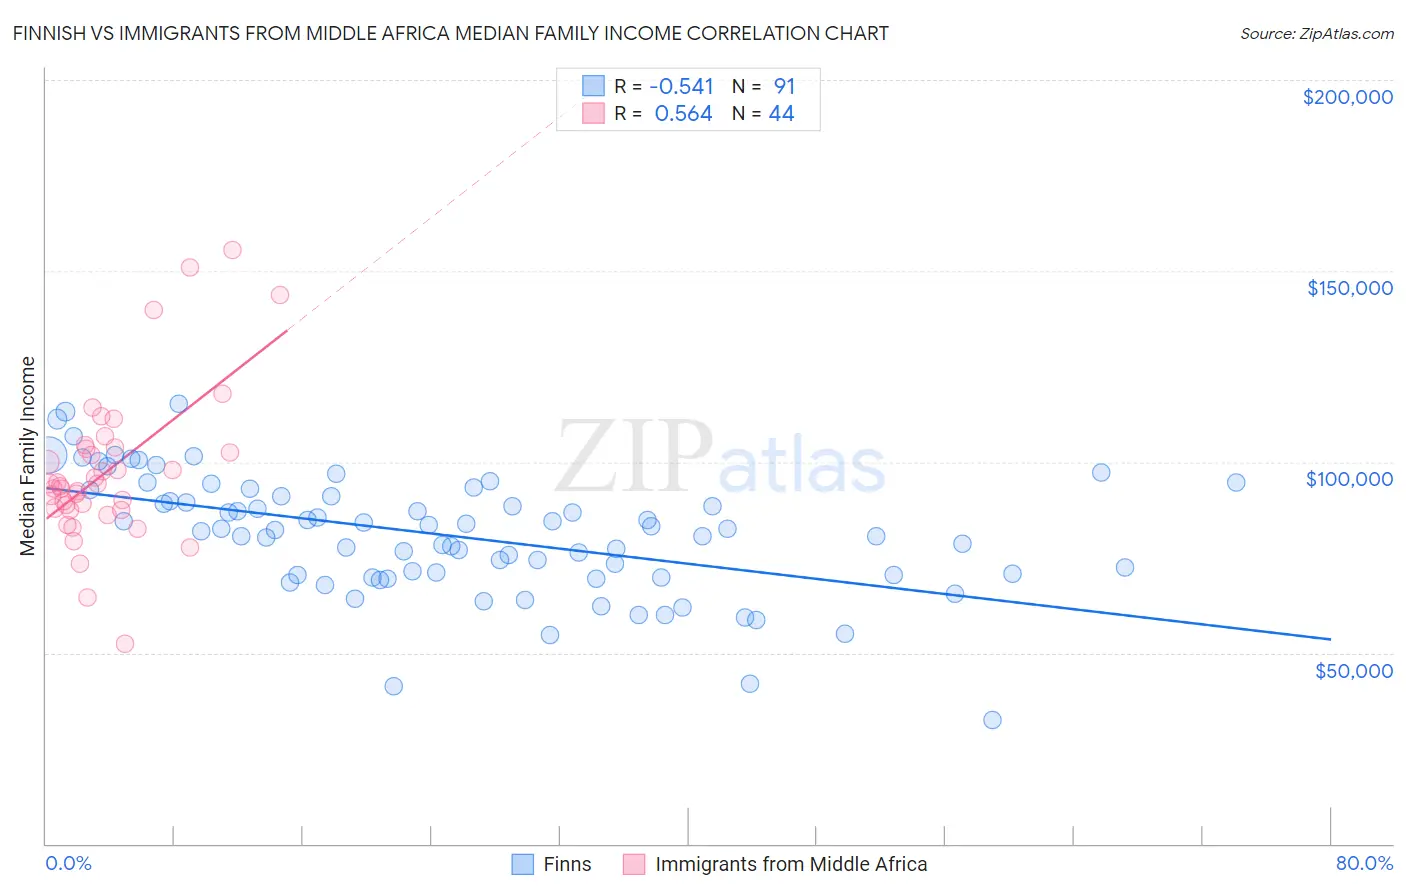
Finnish vs Immigrants from Middle Africa Median Family Income Correlation Chart
The statistical analysis conducted on geographies consisting of 404,403,352 people shows a substantial negative correlation between the proportion of Finns and median family income in the United States with a correlation coefficient (R) of -0.541 and weighted average of $102,676. Similarly, the statistical analysis conducted on geographies consisting of 202,625,103 people shows a substantial positive correlation between the proportion of Immigrants from Middle Africa and median family income in the United States with a correlation coefficient (R) of 0.564 and weighted average of $93,593, a difference of 9.7%.
Median Family Income Correlation Summary
| Measurement | Finnish | Immigrants from Middle Africa |
| Minimum | $32,321 | $52,432 |
| Maximum | $115,182 | $155,375 |
| Range | $82,861 | $102,943 |
| Mean | $80,730 | $97,654 |
| Median | $82,170 | $93,999 |
| Interquartile 25% (IQ1) | $70,230 | $87,639 |
| Interquartile 75% (IQ3) | $91,138 | $103,622 |
| Interquartile Range (IQR) | $20,909 | $15,984 |
| Standard Deviation (Sample) | $15,710 | $20,164 |
| Standard Deviation (Population) | $15,623 | $19,934 |
Similar Demographics by Median Family Income
Demographics Similar to Finns by Median Family Income
In terms of median family income, the demographic groups most similar to Finns are Belgian ($102,788, a difference of 0.11%), Immigrants from Eritrea ($102,823, a difference of 0.14%), Immigrants from Eastern Africa ($102,451, a difference of 0.22%), French ($102,368, a difference of 0.30%), and Alsatian ($103,010, a difference of 0.33%).
| Demographics | Rating | Rank | Median Family Income |
| South American Indians | 61.9 /100 | #167 | Good $103,624 |
| Immigrants | Peru | 60.8 /100 | #168 | Good $103,534 |
| Czechoslovakians | 57.6 /100 | #169 | Average $103,273 |
| Immigrants | Uzbekistan | 56.6 /100 | #170 | Average $103,197 |
| Alsatians | 54.3 /100 | #171 | Average $103,010 |
| Immigrants | Eritrea | 51.9 /100 | #172 | Average $102,823 |
| Belgians | 51.4 /100 | #173 | Average $102,788 |
| Finns | 50.0 /100 | #174 | Average $102,676 |
| Immigrants | Eastern Africa | 47.1 /100 | #175 | Average $102,451 |
| French | 46.1 /100 | #176 | Average $102,368 |
| Germans | 44.6 /100 | #177 | Average $102,254 |
| Welsh | 43.3 /100 | #178 | Average $102,151 |
| South Americans | 39.7 /100 | #179 | Fair $101,856 |
| French Canadians | 37.0 /100 | #180 | Fair $101,634 |
| Spaniards | 36.8 /100 | #181 | Fair $101,617 |
Demographics Similar to Immigrants from Middle Africa by Median Family Income
In terms of median family income, the demographic groups most similar to Immigrants from Middle Africa are Subsaharan African ($93,748, a difference of 0.17%), Guyanese ($93,373, a difference of 0.23%), German Russian ($93,858, a difference of 0.28%), Barbadian ($93,919, a difference of 0.35%), and Immigrants from Trinidad and Tobago ($93,988, a difference of 0.42%).
| Demographics | Rating | Rank | Median Family Income |
| Nepalese | 1.3 /100 | #238 | Tragic $94,153 |
| Salvadorans | 1.2 /100 | #239 | Tragic $94,109 |
| Somalis | 1.2 /100 | #240 | Tragic $94,085 |
| Immigrants | Trinidad and Tobago | 1.2 /100 | #241 | Tragic $93,988 |
| Barbadians | 1.1 /100 | #242 | Tragic $93,919 |
| German Russians | 1.1 /100 | #243 | Tragic $93,858 |
| Sub-Saharan Africans | 1.0 /100 | #244 | Tragic $93,748 |
| Immigrants | Middle Africa | 1.0 /100 | #245 | Tragic $93,593 |
| Guyanese | 0.9 /100 | #246 | Tragic $93,373 |
| Immigrants | Senegal | 0.7 /100 | #247 | Tragic $92,912 |
| French American Indians | 0.7 /100 | #248 | Tragic $92,872 |
| Immigrants | Ecuador | 0.7 /100 | #249 | Tragic $92,837 |
| West Indians | 0.6 /100 | #250 | Tragic $92,765 |
| Immigrants | Somalia | 0.6 /100 | #251 | Tragic $92,609 |
| Immigrants | El Salvador | 0.6 /100 | #252 | Tragic $92,545 |