Slovak vs Immigrants from Sudan Median Family Income
COMPARE
Slovak
Immigrants from Sudan
Median Family Income
Median Family Income Comparison
Slovaks
Immigrants from Sudan
$103,729
MEDIAN FAMILY INCOME
63.1/ 100
METRIC RATING
165th/ 347
METRIC RANK
$97,737
MEDIAN FAMILY INCOME
7.4/ 100
METRIC RATING
211th/ 347
METRIC RANK
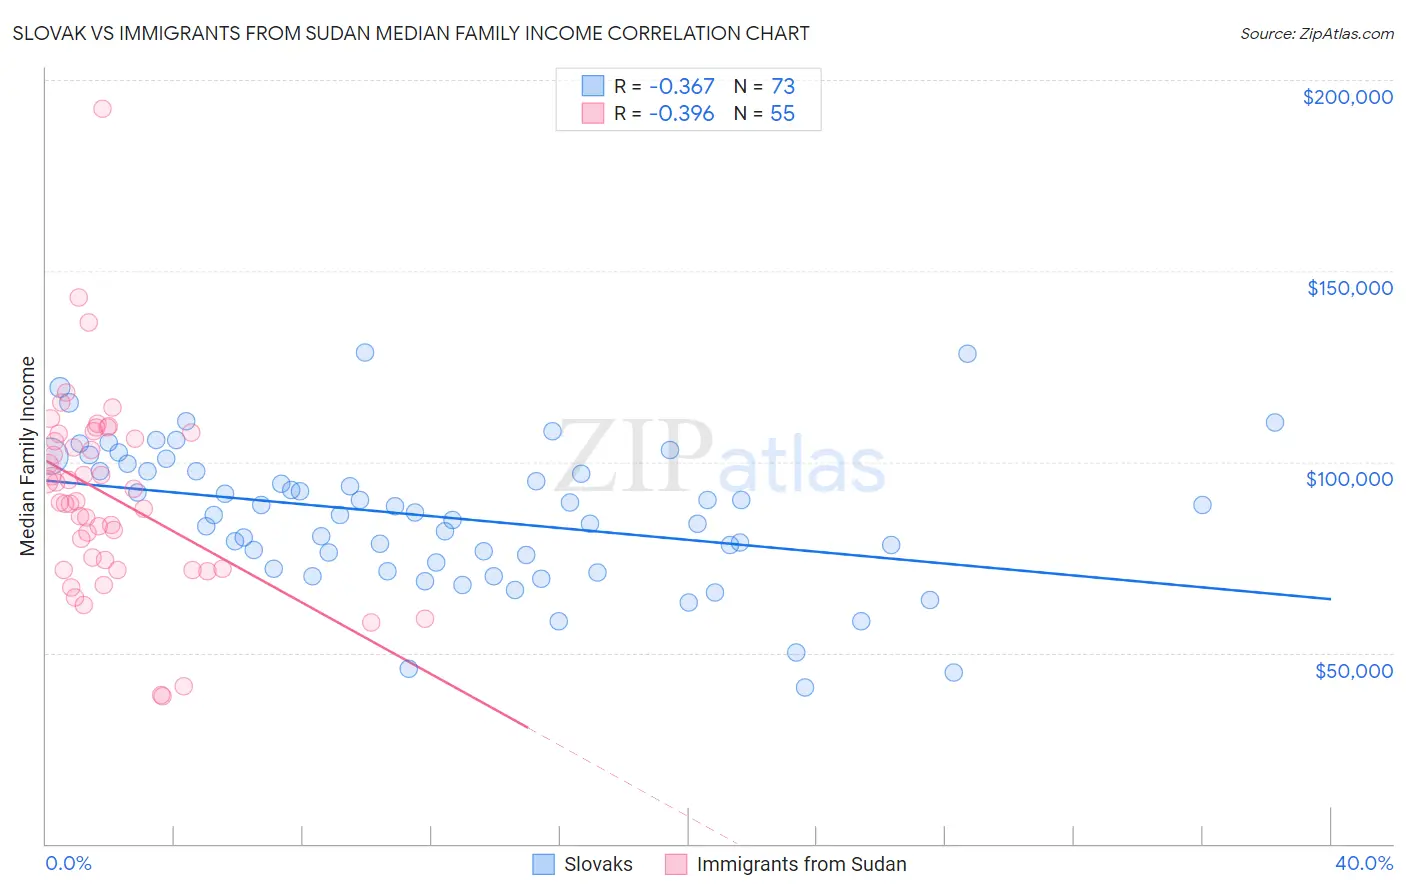
Slovak vs Immigrants from Sudan Median Family Income Correlation Chart
The statistical analysis conducted on geographies consisting of 397,537,551 people shows a mild negative correlation between the proportion of Slovaks and median family income in the United States with a correlation coefficient (R) of -0.367 and weighted average of $103,729. Similarly, the statistical analysis conducted on geographies consisting of 118,933,940 people shows a mild negative correlation between the proportion of Immigrants from Sudan and median family income in the United States with a correlation coefficient (R) of -0.396 and weighted average of $97,737, a difference of 6.1%.
Median Family Income Correlation Summary
| Measurement | Slovak | Immigrants from Sudan |
| Minimum | $40,809 | $38,705 |
| Maximum | $128,732 | $192,500 |
| Range | $87,923 | $153,795 |
| Mean | $85,532 | $91,079 |
| Median | $86,184 | $89,618 |
| Interquartile 25% (IQ1) | $72,785 | $71,964 |
| Interquartile 75% (IQ3) | $97,619 | $107,289 |
| Interquartile Range (IQR) | $24,833 | $35,325 |
| Standard Deviation (Sample) | $18,291 | $25,898 |
| Standard Deviation (Population) | $18,165 | $25,661 |
Similar Demographics by Median Family Income
Demographics Similar to Slovaks by Median Family Income
In terms of median family income, the demographic groups most similar to Slovaks are English ($103,684, a difference of 0.040%), South American Indian ($103,624, a difference of 0.10%), Sierra Leonean ($103,859, a difference of 0.13%), Immigrants from Peru ($103,534, a difference of 0.19%), and Immigrants from Sierra Leone ($103,990, a difference of 0.25%).
| Demographics | Rating | Rank | Median Family Income |
| Scandinavians | 70.8 /100 | #158 | Good $104,410 |
| Swiss | 70.7 /100 | #159 | Good $104,396 |
| Scottish | 69.5 /100 | #160 | Good $104,288 |
| Icelanders | 69.4 /100 | #161 | Good $104,282 |
| Immigrants | Sierra Leone | 66.2 /100 | #162 | Good $103,990 |
| Costa Ricans | 66.2 /100 | #163 | Good $103,989 |
| Sierra Leoneans | 64.7 /100 | #164 | Good $103,859 |
| Slovaks | 63.1 /100 | #165 | Good $103,729 |
| English | 62.6 /100 | #166 | Good $103,684 |
| South American Indians | 61.9 /100 | #167 | Good $103,624 |
| Immigrants | Peru | 60.8 /100 | #168 | Good $103,534 |
| Czechoslovakians | 57.6 /100 | #169 | Average $103,273 |
| Immigrants | Uzbekistan | 56.6 /100 | #170 | Average $103,197 |
| Alsatians | 54.3 /100 | #171 | Average $103,010 |
| Immigrants | Eritrea | 51.9 /100 | #172 | Average $102,823 |
Demographics Similar to Immigrants from Sudan by Median Family Income
In terms of median family income, the demographic groups most similar to Immigrants from Sudan are Panamanian ($97,683, a difference of 0.050%), Immigrants from Armenia ($97,605, a difference of 0.13%), Bermudan ($97,577, a difference of 0.16%), Nigerian ($97,522, a difference of 0.22%), and Puget Sound Salish ($97,958, a difference of 0.23%).
| Demographics | Rating | Rank | Median Family Income |
| Ghanaians | 12.6 /100 | #204 | Poor $98,877 |
| Hawaiians | 12.5 /100 | #205 | Poor $98,869 |
| Immigrants | Iraq | 12.1 /100 | #206 | Poor $98,786 |
| Aleuts | 11.6 /100 | #207 | Poor $98,702 |
| Immigrants | Uruguay | 9.2 /100 | #208 | Tragic $98,205 |
| Immigrants | Colombia | 8.7 /100 | #209 | Tragic $98,067 |
| Puget Sound Salish | 8.2 /100 | #210 | Tragic $97,958 |
| Immigrants | Sudan | 7.4 /100 | #211 | Tragic $97,737 |
| Panamanians | 7.2 /100 | #212 | Tragic $97,683 |
| Immigrants | Armenia | 7.0 /100 | #213 | Tragic $97,605 |
| Bermudans | 6.9 /100 | #214 | Tragic $97,577 |
| Nigerians | 6.7 /100 | #215 | Tragic $97,522 |
| Immigrants | Bosnia and Herzegovina | 6.4 /100 | #216 | Tragic $97,432 |
| Japanese | 6.0 /100 | #217 | Tragic $97,288 |
| Immigrants | Cambodia | 5.8 /100 | #218 | Tragic $97,222 |