Finnish vs Dutch West Indian Median Family Income
COMPARE
Finnish
Dutch West Indian
Median Family Income
Median Family Income Comparison
Finns
Dutch West Indians
$102,676
MEDIAN FAMILY INCOME
50.0/ 100
METRIC RATING
174th/ 347
METRIC RANK
$81,852
MEDIAN FAMILY INCOME
0.0/ 100
METRIC RATING
329th/ 347
METRIC RANK
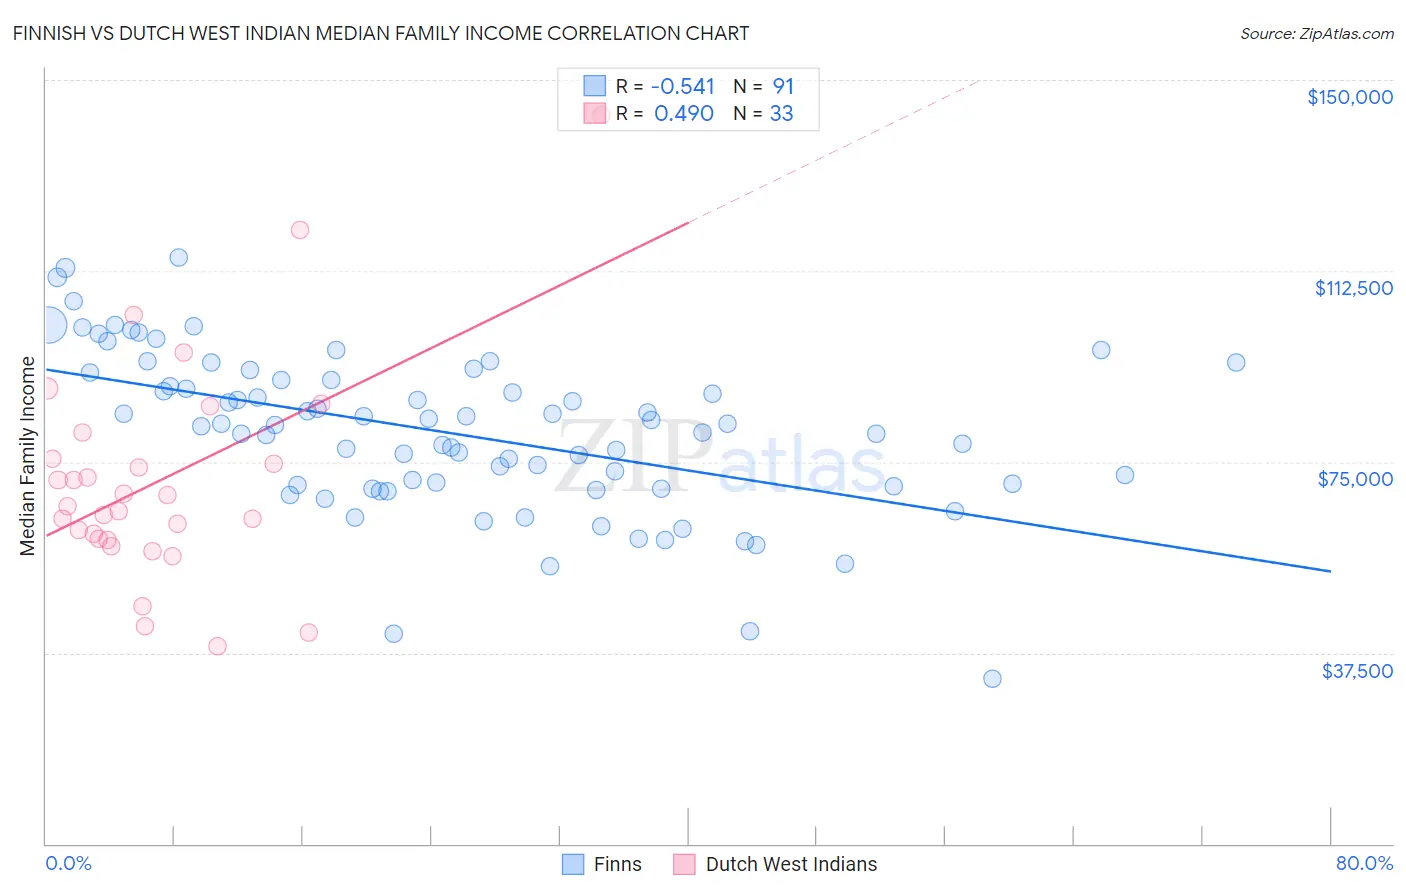
Finnish vs Dutch West Indian Median Family Income Correlation Chart
The statistical analysis conducted on geographies consisting of 404,403,352 people shows a substantial negative correlation between the proportion of Finns and median family income in the United States with a correlation coefficient (R) of -0.541 and weighted average of $102,676. Similarly, the statistical analysis conducted on geographies consisting of 85,761,161 people shows a moderate positive correlation between the proportion of Dutch West Indians and median family income in the United States with a correlation coefficient (R) of 0.490 and weighted average of $81,852, a difference of 25.4%.
Median Family Income Correlation Summary
| Measurement | Finnish | Dutch West Indian |
| Minimum | $32,321 | $38,750 |
| Maximum | $115,182 | $143,036 |
| Range | $82,861 | $104,286 |
| Mean | $80,730 | $71,323 |
| Median | $82,170 | $66,291 |
| Interquartile 25% (IQ1) | $70,230 | $59,737 |
| Interquartile 75% (IQ3) | $91,138 | $78,266 |
| Interquartile Range (IQR) | $20,909 | $18,529 |
| Standard Deviation (Sample) | $15,710 | $21,583 |
| Standard Deviation (Population) | $15,623 | $21,254 |
Similar Demographics by Median Family Income
Demographics Similar to Finns by Median Family Income
In terms of median family income, the demographic groups most similar to Finns are Belgian ($102,788, a difference of 0.11%), Immigrants from Eritrea ($102,823, a difference of 0.14%), Immigrants from Eastern Africa ($102,451, a difference of 0.22%), French ($102,368, a difference of 0.30%), and Alsatian ($103,010, a difference of 0.33%).
| Demographics | Rating | Rank | Median Family Income |
| South American Indians | 61.9 /100 | #167 | Good $103,624 |
| Immigrants | Peru | 60.8 /100 | #168 | Good $103,534 |
| Czechoslovakians | 57.6 /100 | #169 | Average $103,273 |
| Immigrants | Uzbekistan | 56.6 /100 | #170 | Average $103,197 |
| Alsatians | 54.3 /100 | #171 | Average $103,010 |
| Immigrants | Eritrea | 51.9 /100 | #172 | Average $102,823 |
| Belgians | 51.4 /100 | #173 | Average $102,788 |
| Finns | 50.0 /100 | #174 | Average $102,676 |
| Immigrants | Eastern Africa | 47.1 /100 | #175 | Average $102,451 |
| French | 46.1 /100 | #176 | Average $102,368 |
| Germans | 44.6 /100 | #177 | Average $102,254 |
| Welsh | 43.3 /100 | #178 | Average $102,151 |
| South Americans | 39.7 /100 | #179 | Fair $101,856 |
| French Canadians | 37.0 /100 | #180 | Fair $101,634 |
| Spaniards | 36.8 /100 | #181 | Fair $101,617 |
Demographics Similar to Dutch West Indians by Median Family Income
In terms of median family income, the demographic groups most similar to Dutch West Indians are Black/African American ($81,912, a difference of 0.070%), Arapaho ($82,064, a difference of 0.26%), Immigrants from Congo ($82,216, a difference of 0.45%), Cheyenne ($81,385, a difference of 0.57%), and Sioux ($82,386, a difference of 0.65%).
| Demographics | Rating | Rank | Median Family Income |
| Dominicans | 0.0 /100 | #322 | Tragic $82,888 |
| Bahamians | 0.0 /100 | #323 | Tragic $82,631 |
| Creek | 0.0 /100 | #324 | Tragic $82,560 |
| Sioux | 0.0 /100 | #325 | Tragic $82,386 |
| Immigrants | Congo | 0.0 /100 | #326 | Tragic $82,216 |
| Arapaho | 0.0 /100 | #327 | Tragic $82,064 |
| Blacks/African Americans | 0.0 /100 | #328 | Tragic $81,912 |
| Dutch West Indians | 0.0 /100 | #329 | Tragic $81,852 |
| Cheyenne | 0.0 /100 | #330 | Tragic $81,385 |
| Immigrants | Dominican Republic | 0.0 /100 | #331 | Tragic $81,233 |
| Natives/Alaskans | 0.0 /100 | #332 | Tragic $80,908 |
| Kiowa | 0.0 /100 | #333 | Tragic $80,885 |
| Menominee | 0.0 /100 | #334 | Tragic $79,563 |
| Yup'ik | 0.0 /100 | #335 | Tragic $79,290 |
| Immigrants | Cuba | 0.0 /100 | #336 | Tragic $78,249 |