Finnish vs Immigrants from Kazakhstan Median Family Income
COMPARE
Finnish
Immigrants from Kazakhstan
Median Family Income
Median Family Income Comparison
Finns
Immigrants from Kazakhstan
$102,676
MEDIAN FAMILY INCOME
50.0/ 100
METRIC RATING
174th/ 347
METRIC RANK
$110,137
MEDIAN FAMILY INCOME
97.8/ 100
METRIC RATING
93rd/ 347
METRIC RANK
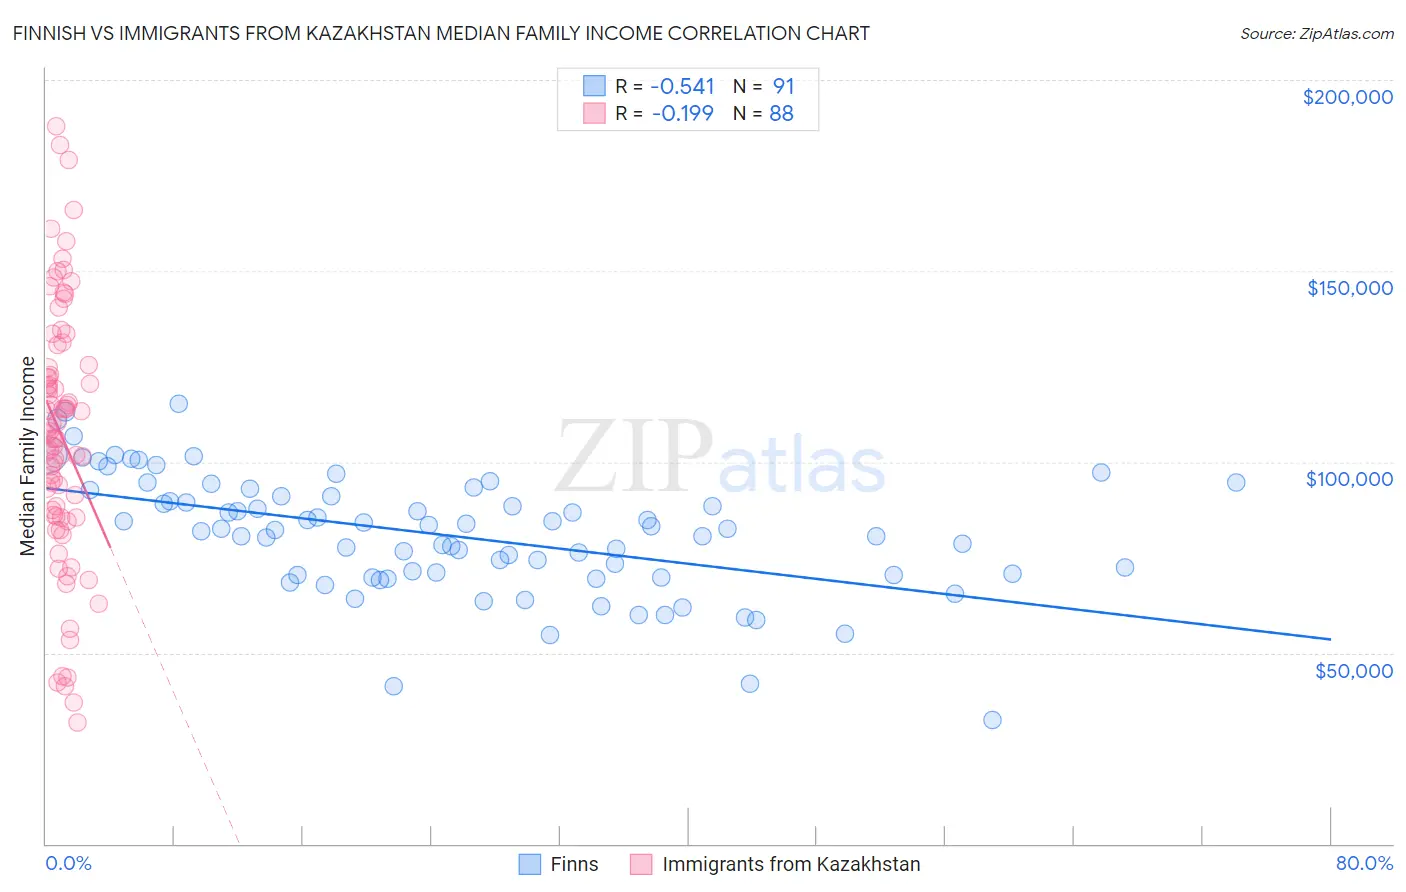
Finnish vs Immigrants from Kazakhstan Median Family Income Correlation Chart
The statistical analysis conducted on geographies consisting of 404,403,352 people shows a substantial negative correlation between the proportion of Finns and median family income in the United States with a correlation coefficient (R) of -0.541 and weighted average of $102,676. Similarly, the statistical analysis conducted on geographies consisting of 124,424,095 people shows a poor negative correlation between the proportion of Immigrants from Kazakhstan and median family income in the United States with a correlation coefficient (R) of -0.199 and weighted average of $110,137, a difference of 7.3%.
Median Family Income Correlation Summary
| Measurement | Finnish | Immigrants from Kazakhstan |
| Minimum | $32,321 | $31,653 |
| Maximum | $115,182 | $187,745 |
| Range | $82,861 | $156,092 |
| Mean | $80,730 | $107,291 |
| Median | $82,170 | $107,620 |
| Interquartile 25% (IQ1) | $70,230 | $85,937 |
| Interquartile 75% (IQ3) | $91,138 | $125,121 |
| Interquartile Range (IQR) | $20,909 | $39,184 |
| Standard Deviation (Sample) | $15,710 | $33,362 |
| Standard Deviation (Population) | $15,623 | $33,172 |
Similar Demographics by Median Family Income
Demographics Similar to Finns by Median Family Income
In terms of median family income, the demographic groups most similar to Finns are Belgian ($102,788, a difference of 0.11%), Immigrants from Eritrea ($102,823, a difference of 0.14%), Immigrants from Eastern Africa ($102,451, a difference of 0.22%), French ($102,368, a difference of 0.30%), and Alsatian ($103,010, a difference of 0.33%).
| Demographics | Rating | Rank | Median Family Income |
| South American Indians | 61.9 /100 | #167 | Good $103,624 |
| Immigrants | Peru | 60.8 /100 | #168 | Good $103,534 |
| Czechoslovakians | 57.6 /100 | #169 | Average $103,273 |
| Immigrants | Uzbekistan | 56.6 /100 | #170 | Average $103,197 |
| Alsatians | 54.3 /100 | #171 | Average $103,010 |
| Immigrants | Eritrea | 51.9 /100 | #172 | Average $102,823 |
| Belgians | 51.4 /100 | #173 | Average $102,788 |
| Finns | 50.0 /100 | #174 | Average $102,676 |
| Immigrants | Eastern Africa | 47.1 /100 | #175 | Average $102,451 |
| French | 46.1 /100 | #176 | Average $102,368 |
| Germans | 44.6 /100 | #177 | Average $102,254 |
| Welsh | 43.3 /100 | #178 | Average $102,151 |
| South Americans | 39.7 /100 | #179 | Fair $101,856 |
| French Canadians | 37.0 /100 | #180 | Fair $101,634 |
| Spaniards | 36.8 /100 | #181 | Fair $101,617 |
Demographics Similar to Immigrants from Kazakhstan by Median Family Income
In terms of median family income, the demographic groups most similar to Immigrants from Kazakhstan are Immigrants from Lebanon ($110,159, a difference of 0.020%), Korean ($110,103, a difference of 0.030%), Zimbabwean ($110,011, a difference of 0.11%), Immigrants from Moldova ($109,975, a difference of 0.15%), and Jordanian ($109,865, a difference of 0.25%).
| Demographics | Rating | Rank | Median Family Income |
| Ukrainians | 98.8 /100 | #86 | Exceptional $111,368 |
| Austrians | 98.8 /100 | #87 | Exceptional $111,306 |
| Romanians | 98.8 /100 | #88 | Exceptional $111,243 |
| Immigrants | Argentina | 98.5 /100 | #89 | Exceptional $110,873 |
| Northern Europeans | 98.3 /100 | #90 | Exceptional $110,635 |
| Immigrants | Southern Europe | 98.3 /100 | #91 | Exceptional $110,614 |
| Immigrants | Lebanon | 97.9 /100 | #92 | Exceptional $110,159 |
| Immigrants | Kazakhstan | 97.8 /100 | #93 | Exceptional $110,137 |
| Koreans | 97.8 /100 | #94 | Exceptional $110,103 |
| Zimbabweans | 97.7 /100 | #95 | Exceptional $110,011 |
| Immigrants | Moldova | 97.7 /100 | #96 | Exceptional $109,975 |
| Jordanians | 97.5 /100 | #97 | Exceptional $109,865 |
| Immigrants | Kuwait | 97.4 /100 | #98 | Exceptional $109,731 |
| Armenians | 97.3 /100 | #99 | Exceptional $109,692 |
| Macedonians | 97.3 /100 | #100 | Exceptional $109,668 |