Finnish vs Immigrants from Cameroon Median Family Income
COMPARE
Finnish
Immigrants from Cameroon
Median Family Income
Median Family Income Comparison
Finns
Immigrants from Cameroon
$102,676
MEDIAN FAMILY INCOME
50.0/ 100
METRIC RATING
174th/ 347
METRIC RANK
$100,289
MEDIAN FAMILY INCOME
22.8/ 100
METRIC RATING
197th/ 347
METRIC RANK
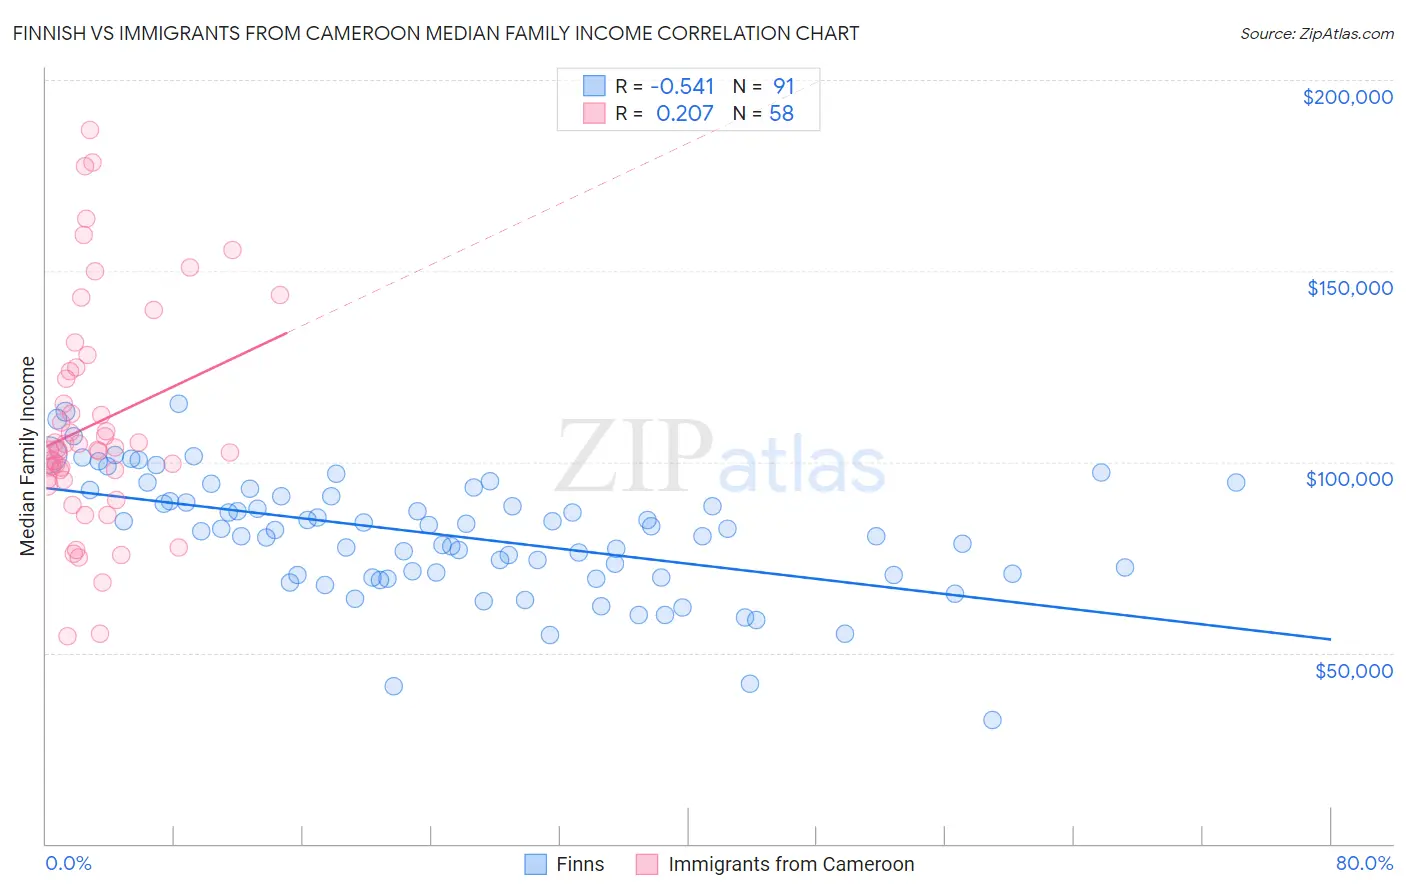
Finnish vs Immigrants from Cameroon Median Family Income Correlation Chart
The statistical analysis conducted on geographies consisting of 404,403,352 people shows a substantial negative correlation between the proportion of Finns and median family income in the United States with a correlation coefficient (R) of -0.541 and weighted average of $102,676. Similarly, the statistical analysis conducted on geographies consisting of 130,726,829 people shows a weak positive correlation between the proportion of Immigrants from Cameroon and median family income in the United States with a correlation coefficient (R) of 0.207 and weighted average of $100,289, a difference of 2.4%.
Median Family Income Correlation Summary
| Measurement | Finnish | Immigrants from Cameroon |
| Minimum | $32,321 | $54,178 |
| Maximum | $115,182 | $186,802 |
| Range | $82,861 | $132,624 |
| Mean | $80,730 | $109,949 |
| Median | $82,170 | $103,317 |
| Interquartile 25% (IQ1) | $70,230 | $95,592 |
| Interquartile 75% (IQ3) | $91,138 | $123,784 |
| Interquartile Range (IQR) | $20,909 | $28,192 |
| Standard Deviation (Sample) | $15,710 | $29,032 |
| Standard Deviation (Population) | $15,623 | $28,780 |
Similar Demographics by Median Family Income
Demographics Similar to Finns by Median Family Income
In terms of median family income, the demographic groups most similar to Finns are Belgian ($102,788, a difference of 0.11%), Immigrants from Eritrea ($102,823, a difference of 0.14%), Immigrants from Eastern Africa ($102,451, a difference of 0.22%), French ($102,368, a difference of 0.30%), and Alsatian ($103,010, a difference of 0.33%).
| Demographics | Rating | Rank | Median Family Income |
| South American Indians | 61.9 /100 | #167 | Good $103,624 |
| Immigrants | Peru | 60.8 /100 | #168 | Good $103,534 |
| Czechoslovakians | 57.6 /100 | #169 | Average $103,273 |
| Immigrants | Uzbekistan | 56.6 /100 | #170 | Average $103,197 |
| Alsatians | 54.3 /100 | #171 | Average $103,010 |
| Immigrants | Eritrea | 51.9 /100 | #172 | Average $102,823 |
| Belgians | 51.4 /100 | #173 | Average $102,788 |
| Finns | 50.0 /100 | #174 | Average $102,676 |
| Immigrants | Eastern Africa | 47.1 /100 | #175 | Average $102,451 |
| French | 46.1 /100 | #176 | Average $102,368 |
| Germans | 44.6 /100 | #177 | Average $102,254 |
| Welsh | 43.3 /100 | #178 | Average $102,151 |
| South Americans | 39.7 /100 | #179 | Fair $101,856 |
| French Canadians | 37.0 /100 | #180 | Fair $101,634 |
| Spaniards | 36.8 /100 | #181 | Fair $101,617 |
Demographics Similar to Immigrants from Cameroon by Median Family Income
In terms of median family income, the demographic groups most similar to Immigrants from Cameroon are Immigrants from Africa ($100,256, a difference of 0.030%), Samoan ($100,344, a difference of 0.060%), Immigrants from South America ($100,414, a difference of 0.12%), Yugoslavian ($100,119, a difference of 0.17%), and Spanish ($99,977, a difference of 0.31%).
| Demographics | Rating | Rank | Median Family Income |
| Immigrants | Immigrants | 29.4 /100 | #190 | Fair $100,962 |
| Colombians | 27.2 /100 | #191 | Fair $100,750 |
| Immigrants | Kenya | 26.5 /100 | #192 | Fair $100,679 |
| Iraqis | 26.3 /100 | #193 | Fair $100,658 |
| Uruguayans | 26.3 /100 | #194 | Fair $100,656 |
| Immigrants | South America | 23.9 /100 | #195 | Fair $100,414 |
| Samoans | 23.3 /100 | #196 | Fair $100,344 |
| Immigrants | Cameroon | 22.8 /100 | #197 | Fair $100,289 |
| Immigrants | Africa | 22.5 /100 | #198 | Fair $100,256 |
| Yugoslavians | 21.3 /100 | #199 | Fair $100,119 |
| Spanish | 20.1 /100 | #200 | Fair $99,977 |
| Immigrants | Thailand | 19.0 /100 | #201 | Poor $99,840 |
| Whites/Caucasians | 18.7 /100 | #202 | Poor $99,800 |
| Scotch-Irish | 17.1 /100 | #203 | Poor $99,591 |
| Ghanaians | 12.6 /100 | #204 | Poor $98,877 |