Finnish vs Colombian Median Family Income
COMPARE
Finnish
Colombian
Median Family Income
Median Family Income Comparison
Finns
Colombians
$102,676
MEDIAN FAMILY INCOME
50.0/ 100
METRIC RATING
174th/ 347
METRIC RANK
$100,750
MEDIAN FAMILY INCOME
27.2/ 100
METRIC RATING
191st/ 347
METRIC RANK
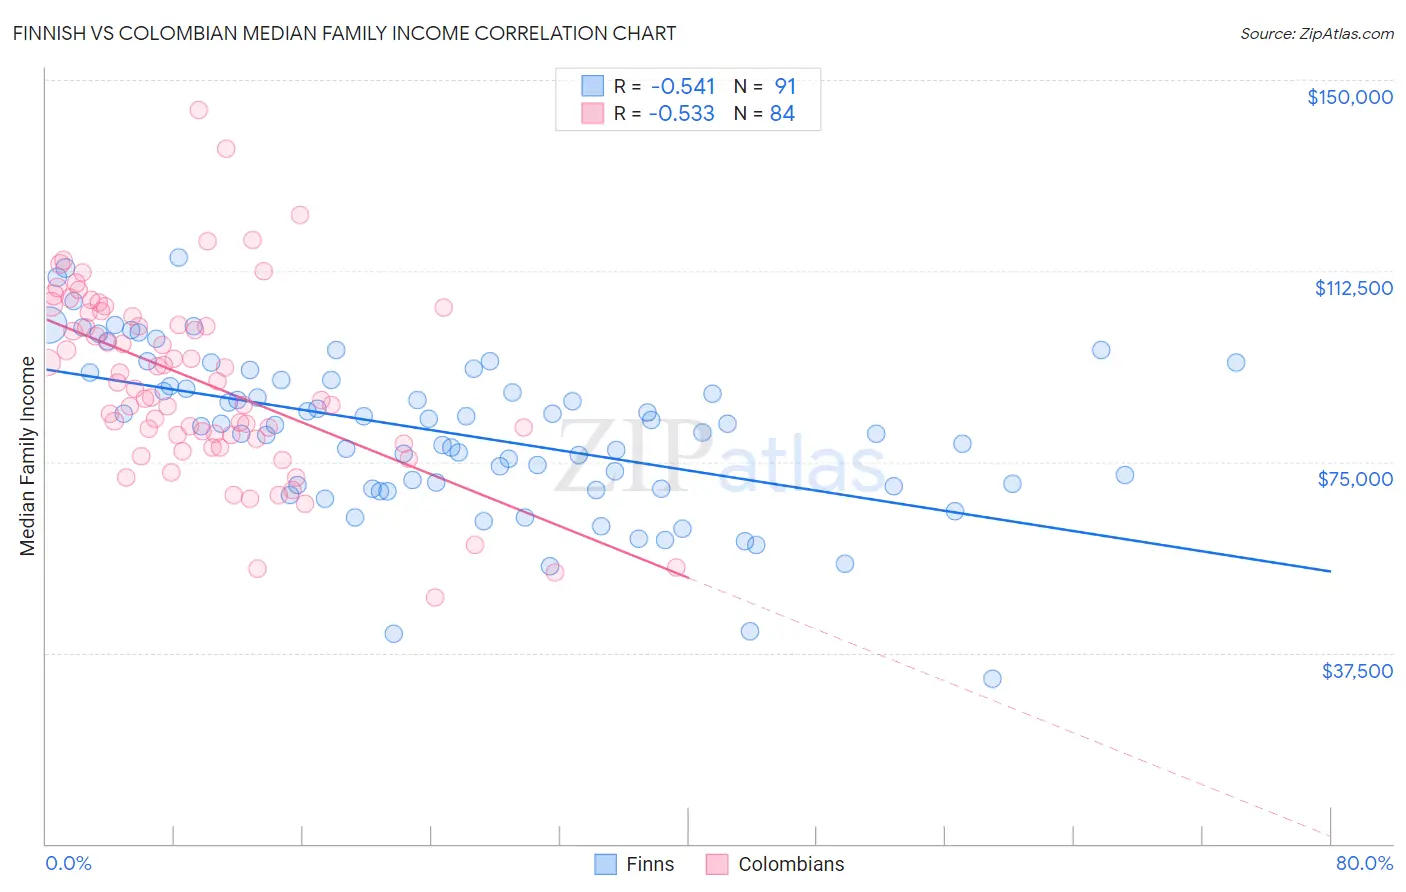
Finnish vs Colombian Median Family Income Correlation Chart
The statistical analysis conducted on geographies consisting of 404,403,352 people shows a substantial negative correlation between the proportion of Finns and median family income in the United States with a correlation coefficient (R) of -0.541 and weighted average of $102,676. Similarly, the statistical analysis conducted on geographies consisting of 419,162,834 people shows a substantial negative correlation between the proportion of Colombians and median family income in the United States with a correlation coefficient (R) of -0.533 and weighted average of $100,750, a difference of 1.9%.
Median Family Income Correlation Summary
| Measurement | Finnish | Colombian |
| Minimum | $32,321 | $48,304 |
| Maximum | $115,182 | $144,224 |
| Range | $82,861 | $95,920 |
| Mean | $80,730 | $90,772 |
| Median | $82,170 | $90,051 |
| Interquartile 25% (IQ1) | $70,230 | $79,908 |
| Interquartile 75% (IQ3) | $91,138 | $103,968 |
| Interquartile Range (IQR) | $20,909 | $24,060 |
| Standard Deviation (Sample) | $15,710 | $18,065 |
| Standard Deviation (Population) | $15,623 | $17,957 |
Demographics Similar to Finns and Colombians by Median Family Income
In terms of median family income, the demographic groups most similar to Finns are Belgian ($102,788, a difference of 0.11%), Immigrants from Eritrea ($102,823, a difference of 0.14%), Immigrants from Eastern Africa ($102,451, a difference of 0.22%), French ($102,368, a difference of 0.30%), and German ($102,254, a difference of 0.41%). Similarly, the demographic groups most similar to Colombians are Immigrants from Kenya ($100,679, a difference of 0.070%), Immigrants ($100,962, a difference of 0.21%), Immigrants from Portugal ($100,984, a difference of 0.23%), Guamanian/Chamorro ($101,061, a difference of 0.31%), and Tlingit-Haida ($101,092, a difference of 0.34%).
| Demographics | Rating | Rank | Median Family Income |
| Immigrants | Eritrea | 51.9 /100 | #172 | Average $102,823 |
| Belgians | 51.4 /100 | #173 | Average $102,788 |
| Finns | 50.0 /100 | #174 | Average $102,676 |
| Immigrants | Eastern Africa | 47.1 /100 | #175 | Average $102,451 |
| French | 46.1 /100 | #176 | Average $102,368 |
| Germans | 44.6 /100 | #177 | Average $102,254 |
| Welsh | 43.3 /100 | #178 | Average $102,151 |
| South Americans | 39.7 /100 | #179 | Fair $101,856 |
| French Canadians | 37.0 /100 | #180 | Fair $101,634 |
| Spaniards | 36.8 /100 | #181 | Fair $101,617 |
| Tsimshian | 35.9 /100 | #182 | Fair $101,543 |
| Kenyans | 34.5 /100 | #183 | Fair $101,417 |
| Immigrants | Costa Rica | 33.7 /100 | #184 | Fair $101,354 |
| Dutch | 31.9 /100 | #185 | Fair $101,192 |
| Celtics | 31.3 /100 | #186 | Fair $101,139 |
| Tlingit-Haida | 30.8 /100 | #187 | Fair $101,092 |
| Guamanians/Chamorros | 30.5 /100 | #188 | Fair $101,061 |
| Immigrants | Portugal | 29.6 /100 | #189 | Fair $100,984 |
| Immigrants | Immigrants | 29.4 /100 | #190 | Fair $100,962 |
| Colombians | 27.2 /100 | #191 | Fair $100,750 |
| Immigrants | Kenya | 26.5 /100 | #192 | Fair $100,679 |