Finnish vs Immigrants from Bahamas Median Family Income
COMPARE
Finnish
Immigrants from Bahamas
Median Family Income
Median Family Income Comparison
Finns
Immigrants from Bahamas
$102,676
MEDIAN FAMILY INCOME
50.0/ 100
METRIC RATING
174th/ 347
METRIC RANK
$84,732
MEDIAN FAMILY INCOME
0.0/ 100
METRIC RATING
314th/ 347
METRIC RANK
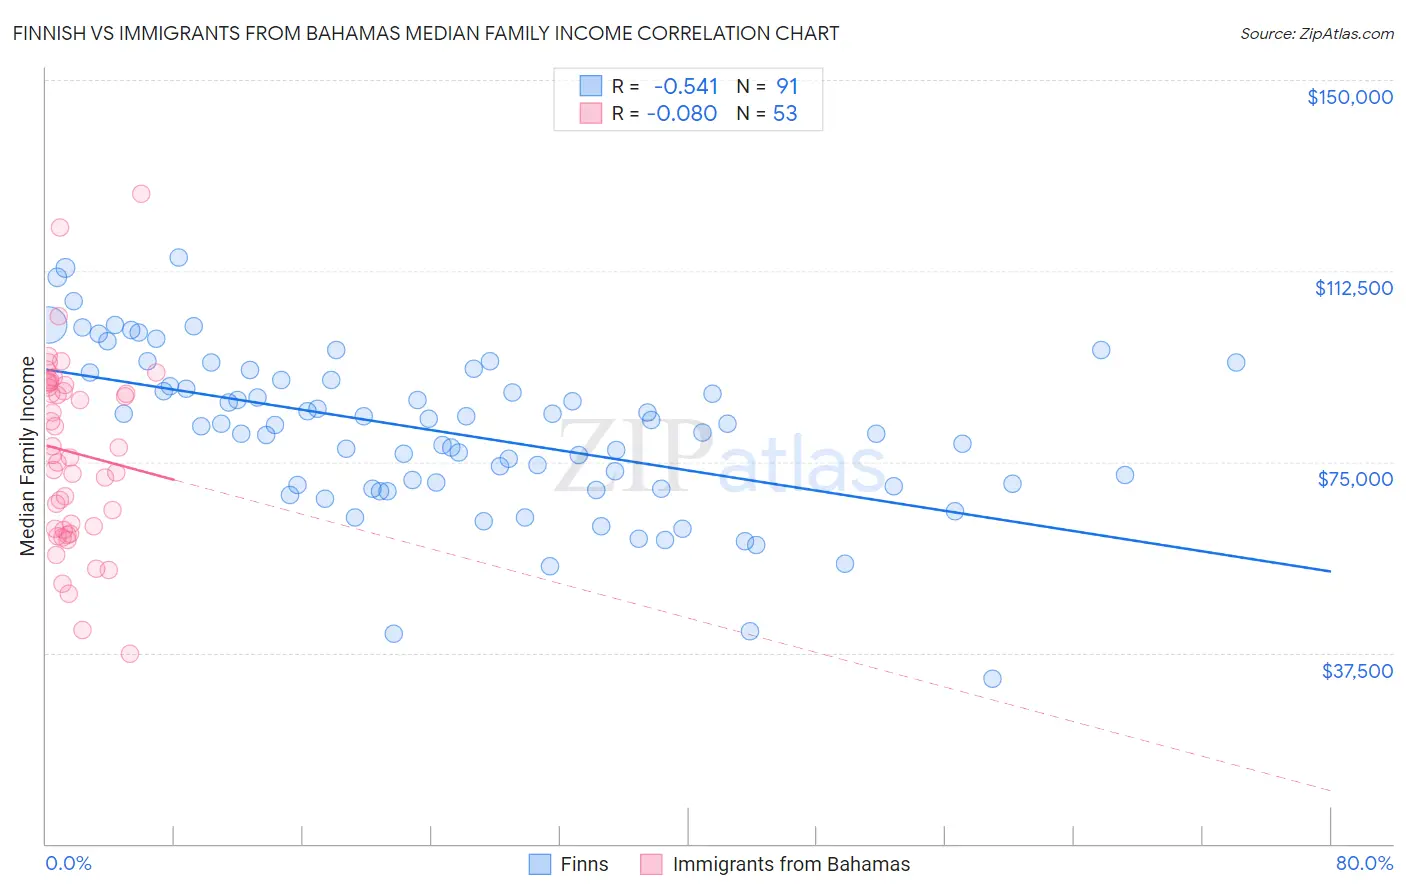
Finnish vs Immigrants from Bahamas Median Family Income Correlation Chart
The statistical analysis conducted on geographies consisting of 404,403,352 people shows a substantial negative correlation between the proportion of Finns and median family income in the United States with a correlation coefficient (R) of -0.541 and weighted average of $102,676. Similarly, the statistical analysis conducted on geographies consisting of 104,583,914 people shows a slight negative correlation between the proportion of Immigrants from Bahamas and median family income in the United States with a correlation coefficient (R) of -0.080 and weighted average of $84,732, a difference of 21.2%.
Median Family Income Correlation Summary
| Measurement | Finnish | Immigrants from Bahamas |
| Minimum | $32,321 | $37,231 |
| Maximum | $115,182 | $127,688 |
| Range | $82,861 | $90,457 |
| Mean | $80,730 | $76,834 |
| Median | $82,170 | $76,465 |
| Interquartile 25% (IQ1) | $70,230 | $61,742 |
| Interquartile 75% (IQ3) | $91,138 | $90,302 |
| Interquartile Range (IQR) | $20,909 | $28,560 |
| Standard Deviation (Sample) | $15,710 | $18,260 |
| Standard Deviation (Population) | $15,623 | $18,087 |
Similar Demographics by Median Family Income
Demographics Similar to Finns by Median Family Income
In terms of median family income, the demographic groups most similar to Finns are Belgian ($102,788, a difference of 0.11%), Immigrants from Eritrea ($102,823, a difference of 0.14%), Immigrants from Eastern Africa ($102,451, a difference of 0.22%), French ($102,368, a difference of 0.30%), and Alsatian ($103,010, a difference of 0.33%).
| Demographics | Rating | Rank | Median Family Income |
| South American Indians | 61.9 /100 | #167 | Good $103,624 |
| Immigrants | Peru | 60.8 /100 | #168 | Good $103,534 |
| Czechoslovakians | 57.6 /100 | #169 | Average $103,273 |
| Immigrants | Uzbekistan | 56.6 /100 | #170 | Average $103,197 |
| Alsatians | 54.3 /100 | #171 | Average $103,010 |
| Immigrants | Eritrea | 51.9 /100 | #172 | Average $102,823 |
| Belgians | 51.4 /100 | #173 | Average $102,788 |
| Finns | 50.0 /100 | #174 | Average $102,676 |
| Immigrants | Eastern Africa | 47.1 /100 | #175 | Average $102,451 |
| French | 46.1 /100 | #176 | Average $102,368 |
| Germans | 44.6 /100 | #177 | Average $102,254 |
| Welsh | 43.3 /100 | #178 | Average $102,151 |
| South Americans | 39.7 /100 | #179 | Fair $101,856 |
| French Canadians | 37.0 /100 | #180 | Fair $101,634 |
| Spaniards | 36.8 /100 | #181 | Fair $101,617 |
Demographics Similar to Immigrants from Bahamas by Median Family Income
In terms of median family income, the demographic groups most similar to Immigrants from Bahamas are Choctaw ($84,835, a difference of 0.12%), Cuban ($84,981, a difference of 0.29%), Honduran ($85,004, a difference of 0.32%), Apache ($84,451, a difference of 0.33%), and Immigrants from Central America ($85,050, a difference of 0.37%).
| Demographics | Rating | Rank | Median Family Income |
| Chickasaw | 0.0 /100 | #307 | Tragic $85,356 |
| U.S. Virgin Islanders | 0.0 /100 | #308 | Tragic $85,294 |
| Haitians | 0.0 /100 | #309 | Tragic $85,218 |
| Immigrants | Central America | 0.0 /100 | #310 | Tragic $85,050 |
| Hondurans | 0.0 /100 | #311 | Tragic $85,004 |
| Cubans | 0.0 /100 | #312 | Tragic $84,981 |
| Choctaw | 0.0 /100 | #313 | Tragic $84,835 |
| Immigrants | Bahamas | 0.0 /100 | #314 | Tragic $84,732 |
| Apache | 0.0 /100 | #315 | Tragic $84,451 |
| Immigrants | Haiti | 0.0 /100 | #316 | Tragic $84,018 |
| Yakama | 0.0 /100 | #317 | Tragic $83,932 |
| Immigrants | Mexico | 0.0 /100 | #318 | Tragic $83,639 |
| Immigrants | Honduras | 0.0 /100 | #319 | Tragic $83,618 |
| Seminole | 0.0 /100 | #320 | Tragic $83,354 |
| Immigrants | Caribbean | 0.0 /100 | #321 | Tragic $83,319 |