Potawatomi vs Immigrants from Sudan Median Family Income
COMPARE
Potawatomi
Immigrants from Sudan
Median Family Income
Median Family Income Comparison
Potawatomi
Immigrants from Sudan
$88,265
MEDIAN FAMILY INCOME
0.1/ 100
METRIC RATING
287th/ 347
METRIC RANK
$97,737
MEDIAN FAMILY INCOME
7.4/ 100
METRIC RATING
211th/ 347
METRIC RANK
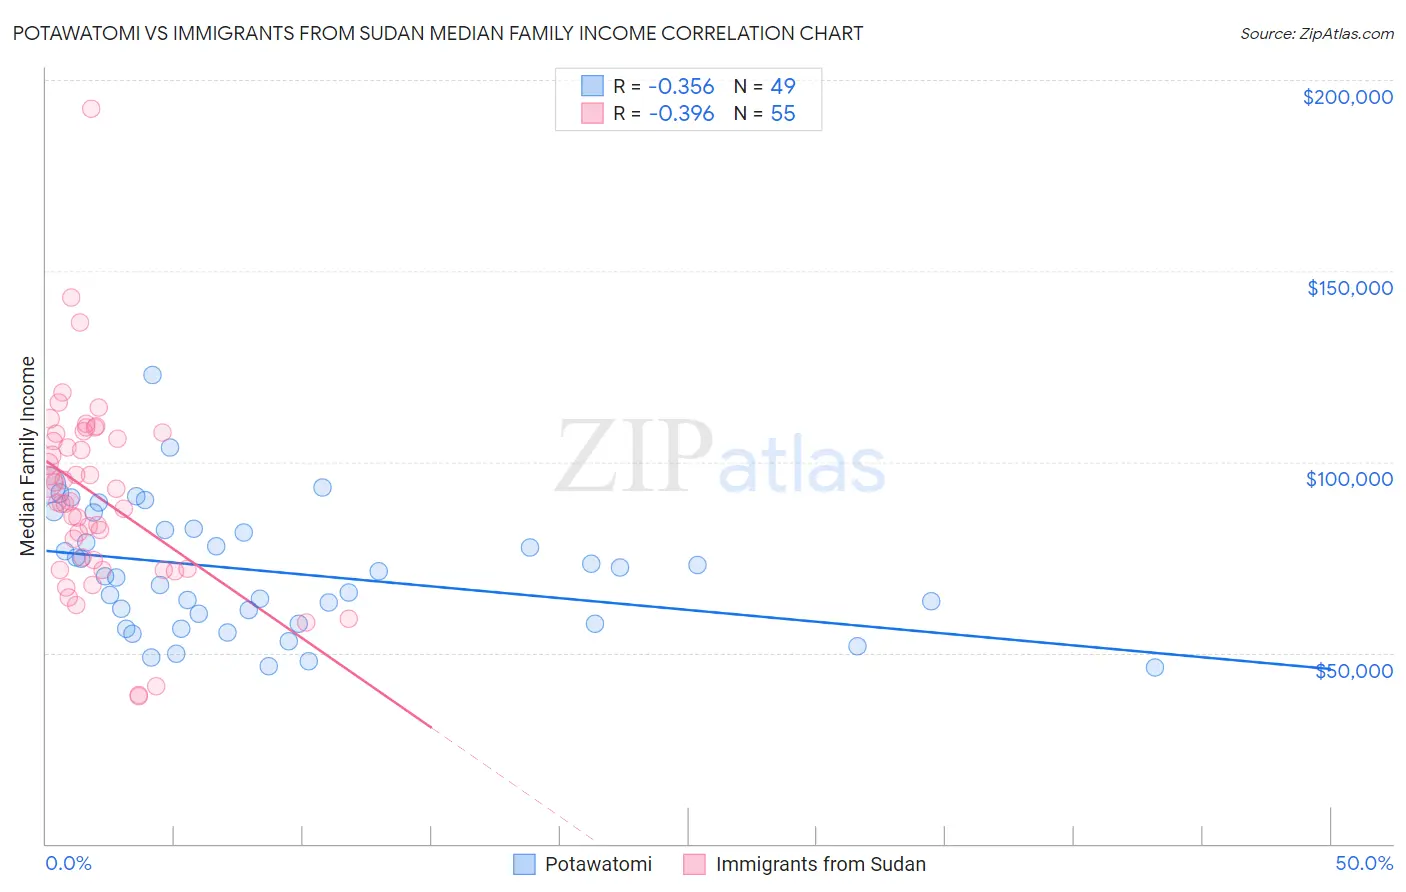
Potawatomi vs Immigrants from Sudan Median Family Income Correlation Chart
The statistical analysis conducted on geographies consisting of 117,752,376 people shows a mild negative correlation between the proportion of Potawatomi and median family income in the United States with a correlation coefficient (R) of -0.356 and weighted average of $88,265. Similarly, the statistical analysis conducted on geographies consisting of 118,933,940 people shows a mild negative correlation between the proportion of Immigrants from Sudan and median family income in the United States with a correlation coefficient (R) of -0.396 and weighted average of $97,737, a difference of 10.7%.
Median Family Income Correlation Summary
| Measurement | Potawatomi | Immigrants from Sudan |
| Minimum | $46,250 | $38,705 |
| Maximum | $122,813 | $192,500 |
| Range | $76,563 | $153,795 |
| Mean | $71,315 | $91,079 |
| Median | $70,018 | $89,618 |
| Interquartile 25% (IQ1) | $57,500 | $71,964 |
| Interquartile 75% (IQ3) | $82,232 | $107,289 |
| Interquartile Range (IQR) | $24,732 | $35,325 |
| Standard Deviation (Sample) | $16,474 | $25,898 |
| Standard Deviation (Population) | $16,305 | $25,661 |
Similar Demographics by Median Family Income
Demographics Similar to Potawatomi by Median Family Income
In terms of median family income, the demographic groups most similar to Potawatomi are Immigrants from Nicaragua ($88,267, a difference of 0.0%), Guatemalan ($88,295, a difference of 0.030%), Indonesian ($88,301, a difference of 0.040%), Cherokee ($88,209, a difference of 0.060%), and Bangladeshi ($88,358, a difference of 0.11%).
| Demographics | Rating | Rank | Median Family Income |
| British West Indians | 0.1 /100 | #280 | Tragic $88,987 |
| Blackfeet | 0.1 /100 | #281 | Tragic $88,717 |
| Comanche | 0.1 /100 | #282 | Tragic $88,556 |
| Bangladeshis | 0.1 /100 | #283 | Tragic $88,358 |
| Indonesians | 0.1 /100 | #284 | Tragic $88,301 |
| Guatemalans | 0.1 /100 | #285 | Tragic $88,295 |
| Immigrants | Nicaragua | 0.1 /100 | #286 | Tragic $88,267 |
| Potawatomi | 0.1 /100 | #287 | Tragic $88,265 |
| Cherokee | 0.1 /100 | #288 | Tragic $88,209 |
| Central American Indians | 0.1 /100 | #289 | Tragic $88,034 |
| Shoshone | 0.1 /100 | #290 | Tragic $87,872 |
| Immigrants | Cabo Verde | 0.1 /100 | #291 | Tragic $87,830 |
| Africans | 0.1 /100 | #292 | Tragic $87,820 |
| Ute | 0.0 /100 | #293 | Tragic $87,596 |
| Fijians | 0.0 /100 | #294 | Tragic $87,387 |
Demographics Similar to Immigrants from Sudan by Median Family Income
In terms of median family income, the demographic groups most similar to Immigrants from Sudan are Panamanian ($97,683, a difference of 0.050%), Immigrants from Armenia ($97,605, a difference of 0.13%), Bermudan ($97,577, a difference of 0.16%), Nigerian ($97,522, a difference of 0.22%), and Puget Sound Salish ($97,958, a difference of 0.23%).
| Demographics | Rating | Rank | Median Family Income |
| Ghanaians | 12.6 /100 | #204 | Poor $98,877 |
| Hawaiians | 12.5 /100 | #205 | Poor $98,869 |
| Immigrants | Iraq | 12.1 /100 | #206 | Poor $98,786 |
| Aleuts | 11.6 /100 | #207 | Poor $98,702 |
| Immigrants | Uruguay | 9.2 /100 | #208 | Tragic $98,205 |
| Immigrants | Colombia | 8.7 /100 | #209 | Tragic $98,067 |
| Puget Sound Salish | 8.2 /100 | #210 | Tragic $97,958 |
| Immigrants | Sudan | 7.4 /100 | #211 | Tragic $97,737 |
| Panamanians | 7.2 /100 | #212 | Tragic $97,683 |
| Immigrants | Armenia | 7.0 /100 | #213 | Tragic $97,605 |
| Bermudans | 6.9 /100 | #214 | Tragic $97,577 |
| Nigerians | 6.7 /100 | #215 | Tragic $97,522 |
| Immigrants | Bosnia and Herzegovina | 6.4 /100 | #216 | Tragic $97,432 |
| Japanese | 6.0 /100 | #217 | Tragic $97,288 |
| Immigrants | Cambodia | 5.8 /100 | #218 | Tragic $97,222 |