Czech vs European Median Household Income
COMPARE
Czech
European
Median Household Income
Median Household Income Comparison
Czechs
Europeans
$86,164
MEDIAN HOUSEHOLD INCOME
66.4/ 100
METRIC RATING
163rd/ 347
METRIC RANK
$88,751
MEDIAN HOUSEHOLD INCOME
91.2/ 100
METRIC RATING
132nd/ 347
METRIC RANK
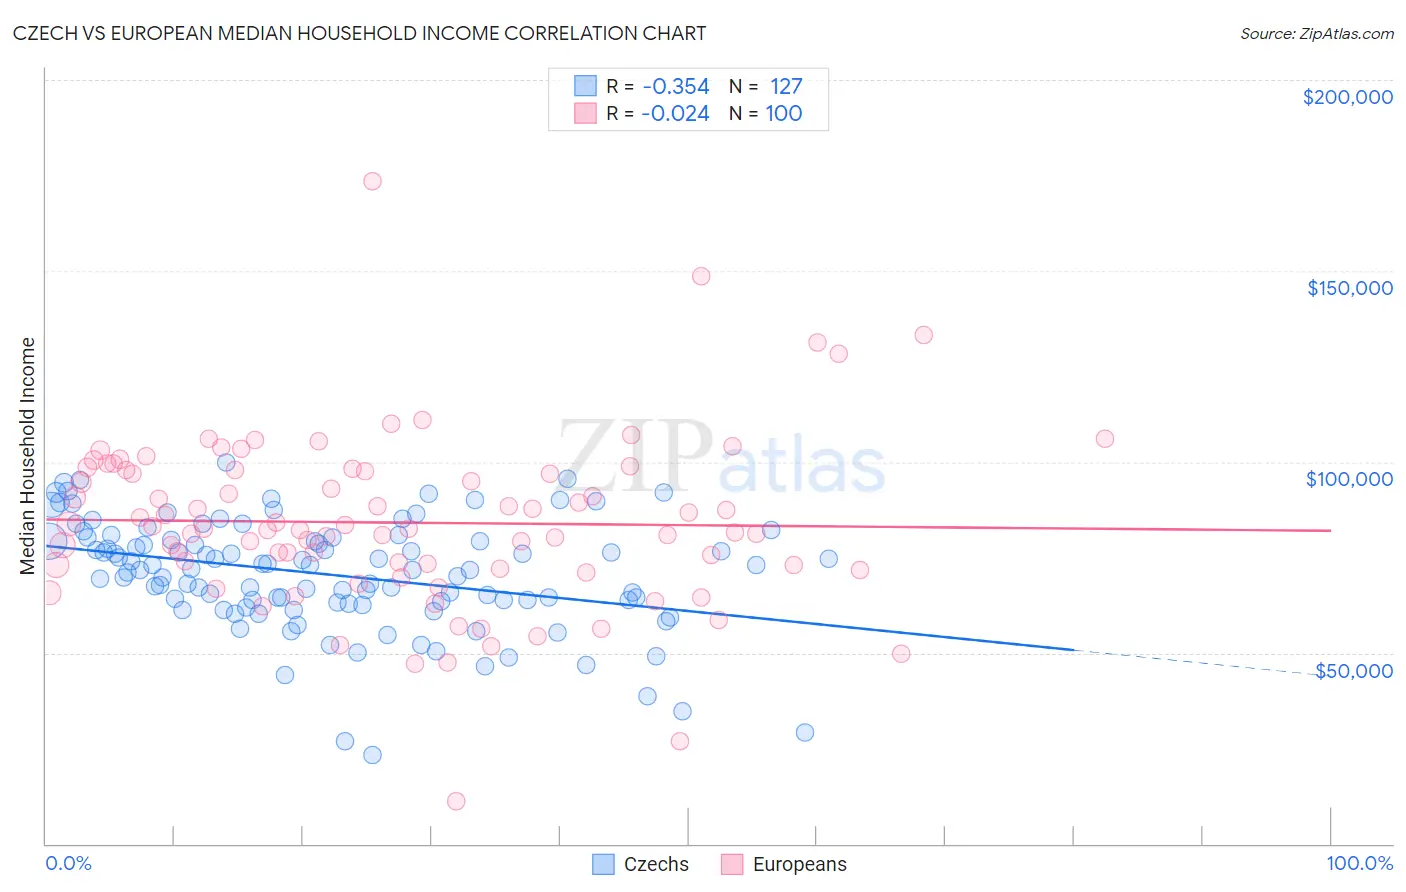
Czech vs European Median Household Income Correlation Chart
The statistical analysis conducted on geographies consisting of 484,294,688 people shows a mild negative correlation between the proportion of Czechs and median household income in the United States with a correlation coefficient (R) of -0.354 and weighted average of $86,164. Similarly, the statistical analysis conducted on geographies consisting of 560,871,034 people shows no correlation between the proportion of Europeans and median household income in the United States with a correlation coefficient (R) of -0.024 and weighted average of $88,751, a difference of 3.0%.
Median Household Income Correlation Summary
| Measurement | Czech | European |
| Minimum | $23,393 | $11,019 |
| Maximum | $99,887 | $173,396 |
| Range | $76,494 | $162,377 |
| Mean | $70,465 | $84,093 |
| Median | $71,750 | $82,550 |
| Interquartile 25% (IQ1) | $63,125 | $72,512 |
| Interquartile 75% (IQ3) | $79,521 | $97,852 |
| Interquartile Range (IQR) | $16,396 | $25,341 |
| Standard Deviation (Sample) | $14,479 | $22,686 |
| Standard Deviation (Population) | $14,422 | $22,572 |
Similar Demographics by Median Household Income
Demographics Similar to Czechs by Median Household Income
In terms of median household income, the demographic groups most similar to Czechs are Irish ($86,145, a difference of 0.020%), Norwegian ($86,084, a difference of 0.090%), Guamanian/Chamorro ($86,255, a difference of 0.11%), Scandinavian ($86,073, a difference of 0.11%), and Slavic ($86,398, a difference of 0.27%).
| Demographics | Rating | Rank | Median Household Income |
| Immigrants | Albania | 71.5 /100 | #156 | Good $86,534 |
| Samoans | 71.0 /100 | #157 | Good $86,498 |
| Moroccans | 70.6 /100 | #158 | Good $86,468 |
| Immigrants | Uzbekistan | 70.1 /100 | #159 | Good $86,425 |
| Luxembourgers | 70.0 /100 | #160 | Good $86,418 |
| Slavs | 69.7 /100 | #161 | Good $86,398 |
| Guamanians/Chamorros | 67.7 /100 | #162 | Good $86,255 |
| Czechs | 66.4 /100 | #163 | Good $86,164 |
| Irish | 66.2 /100 | #164 | Good $86,145 |
| Norwegians | 65.3 /100 | #165 | Good $86,084 |
| Scandinavians | 65.1 /100 | #166 | Good $86,073 |
| Immigrants | Immigrants | 61.3 /100 | #167 | Good $85,818 |
| Icelanders | 61.0 /100 | #168 | Good $85,797 |
| Colombians | 59.7 /100 | #169 | Average $85,716 |
| Swiss | 59.2 /100 | #170 | Average $85,681 |
Demographics Similar to Europeans by Median Household Income
In terms of median household income, the demographic groups most similar to Europeans are Immigrants from Syria ($88,792, a difference of 0.050%), Immigrants from Ethiopia ($88,687, a difference of 0.070%), British ($88,914, a difference of 0.18%), Brazilian ($88,934, a difference of 0.21%), and Portuguese ($88,976, a difference of 0.25%).
| Demographics | Rating | Rank | Median Household Income |
| Immigrants | Kuwait | 93.5 /100 | #125 | Exceptional $89,263 |
| Immigrants | Oceania | 92.9 /100 | #126 | Exceptional $89,100 |
| Immigrants | Peru | 92.5 /100 | #127 | Exceptional $89,010 |
| Portuguese | 92.3 /100 | #128 | Exceptional $88,976 |
| Brazilians | 92.1 /100 | #129 | Exceptional $88,934 |
| British | 92.0 /100 | #130 | Exceptional $88,914 |
| Immigrants | Syria | 91.4 /100 | #131 | Exceptional $88,792 |
| Europeans | 91.2 /100 | #132 | Exceptional $88,751 |
| Immigrants | Ethiopia | 90.9 /100 | #133 | Exceptional $88,687 |
| Swedes | 90.0 /100 | #134 | Exceptional $88,524 |
| Immigrants | Sierra Leone | 89.9 /100 | #135 | Excellent $88,498 |
| Poles | 89.7 /100 | #136 | Excellent $88,472 |
| Sierra Leoneans | 89.6 /100 | #137 | Excellent $88,463 |
| Arabs | 89.2 /100 | #138 | Excellent $88,398 |
| Immigrants | Chile | 89.2 /100 | #139 | Excellent $88,388 |