Laotian vs European Median Household Income
COMPARE
Laotian
European
Median Household Income
Median Household Income Comparison
Laotians
Europeans
$94,990
MEDIAN HOUSEHOLD INCOME
99.8/ 100
METRIC RATING
61st/ 347
METRIC RANK
$88,751
MEDIAN HOUSEHOLD INCOME
91.2/ 100
METRIC RATING
132nd/ 347
METRIC RANK
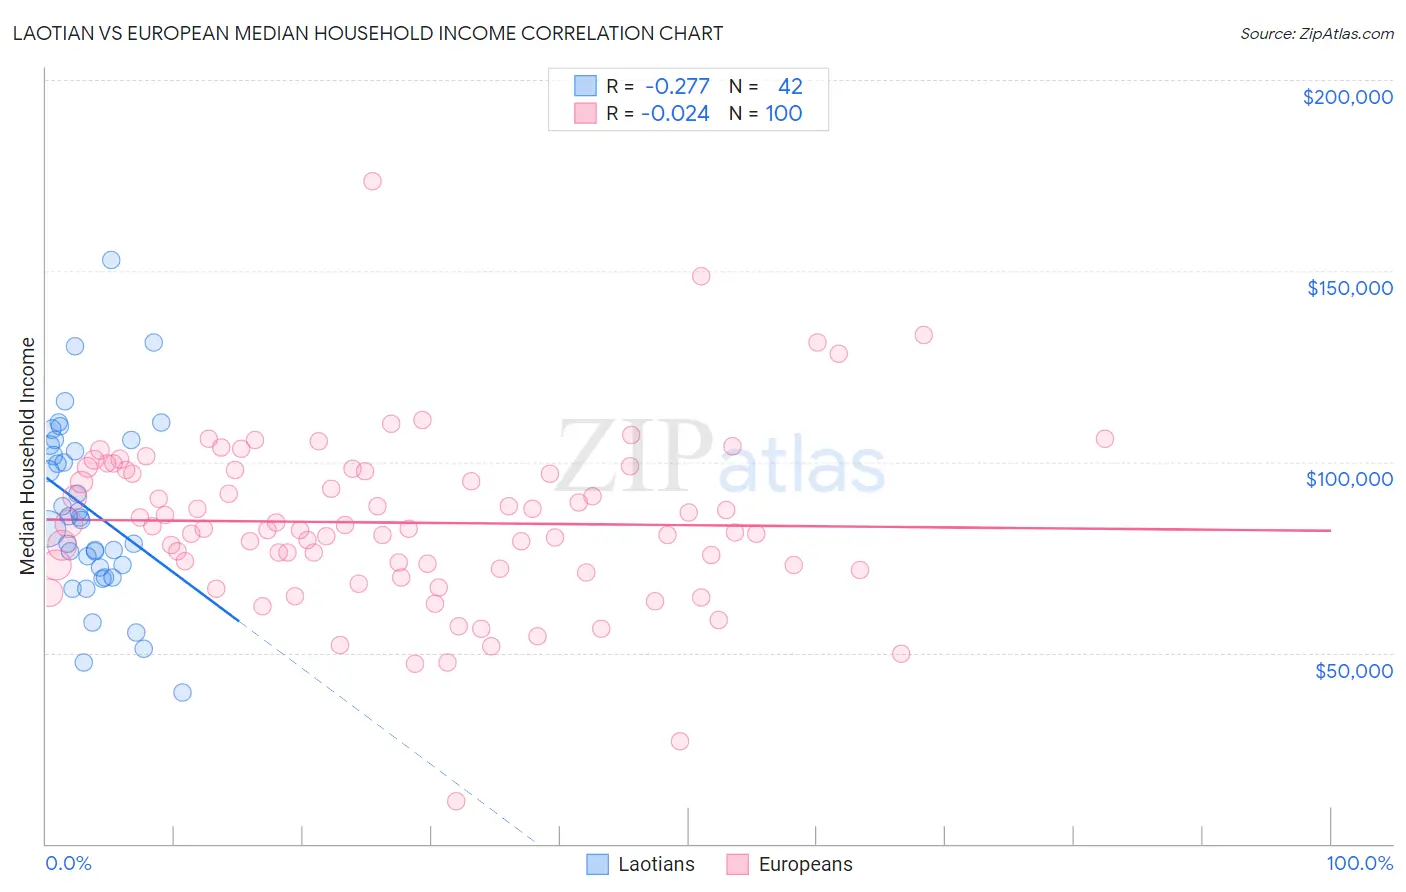
Laotian vs European Median Household Income Correlation Chart
The statistical analysis conducted on geographies consisting of 224,713,642 people shows a weak negative correlation between the proportion of Laotians and median household income in the United States with a correlation coefficient (R) of -0.277 and weighted average of $94,990. Similarly, the statistical analysis conducted on geographies consisting of 560,871,034 people shows no correlation between the proportion of Europeans and median household income in the United States with a correlation coefficient (R) of -0.024 and weighted average of $88,751, a difference of 7.0%.
Median Household Income Correlation Summary
| Measurement | Laotian | European |
| Minimum | $39,542 | $11,019 |
| Maximum | $153,021 | $173,396 |
| Range | $113,479 | $162,377 |
| Mean | $87,400 | $84,093 |
| Median | $85,171 | $82,550 |
| Interquartile 25% (IQ1) | $72,352 | $72,512 |
| Interquartile 75% (IQ3) | $104,389 | $97,852 |
| Interquartile Range (IQR) | $32,037 | $25,341 |
| Standard Deviation (Sample) | $23,584 | $22,686 |
| Standard Deviation (Population) | $23,302 | $22,572 |
Similar Demographics by Median Household Income
Demographics Similar to Laotians by Median Household Income
In terms of median household income, the demographic groups most similar to Laotians are Korean ($95,018, a difference of 0.030%), Immigrants from Europe ($95,032, a difference of 0.040%), Soviet Union ($95,098, a difference of 0.11%), Immigrants from Norway ($94,846, a difference of 0.15%), and New Zealander ($95,146, a difference of 0.16%).
| Demographics | Rating | Rank | Median Household Income |
| Egyptians | 99.9 /100 | #54 | Exceptional $95,673 |
| Immigrants | Czechoslovakia | 99.9 /100 | #55 | Exceptional $95,319 |
| Immigrants | Austria | 99.9 /100 | #56 | Exceptional $95,277 |
| New Zealanders | 99.8 /100 | #57 | Exceptional $95,146 |
| Soviet Union | 99.8 /100 | #58 | Exceptional $95,098 |
| Immigrants | Europe | 99.8 /100 | #59 | Exceptional $95,032 |
| Koreans | 99.8 /100 | #60 | Exceptional $95,018 |
| Laotians | 99.8 /100 | #61 | Exceptional $94,990 |
| Immigrants | Norway | 99.8 /100 | #62 | Exceptional $94,846 |
| Greeks | 99.8 /100 | #63 | Exceptional $94,735 |
| Immigrants | Netherlands | 99.7 /100 | #64 | Exceptional $94,411 |
| Immigrants | Belarus | 99.7 /100 | #65 | Exceptional $94,399 |
| Immigrants | Romania | 99.7 /100 | #66 | Exceptional $94,222 |
| Immigrants | Scotland | 99.7 /100 | #67 | Exceptional $94,091 |
| Mongolians | 99.7 /100 | #68 | Exceptional $93,971 |
Demographics Similar to Europeans by Median Household Income
In terms of median household income, the demographic groups most similar to Europeans are Immigrants from Syria ($88,792, a difference of 0.050%), Immigrants from Ethiopia ($88,687, a difference of 0.070%), British ($88,914, a difference of 0.18%), Brazilian ($88,934, a difference of 0.21%), and Portuguese ($88,976, a difference of 0.25%).
| Demographics | Rating | Rank | Median Household Income |
| Immigrants | Kuwait | 93.5 /100 | #125 | Exceptional $89,263 |
| Immigrants | Oceania | 92.9 /100 | #126 | Exceptional $89,100 |
| Immigrants | Peru | 92.5 /100 | #127 | Exceptional $89,010 |
| Portuguese | 92.3 /100 | #128 | Exceptional $88,976 |
| Brazilians | 92.1 /100 | #129 | Exceptional $88,934 |
| British | 92.0 /100 | #130 | Exceptional $88,914 |
| Immigrants | Syria | 91.4 /100 | #131 | Exceptional $88,792 |
| Europeans | 91.2 /100 | #132 | Exceptional $88,751 |
| Immigrants | Ethiopia | 90.9 /100 | #133 | Exceptional $88,687 |
| Swedes | 90.0 /100 | #134 | Exceptional $88,524 |
| Immigrants | Sierra Leone | 89.9 /100 | #135 | Excellent $88,498 |
| Poles | 89.7 /100 | #136 | Excellent $88,472 |
| Sierra Leoneans | 89.6 /100 | #137 | Excellent $88,463 |
| Arabs | 89.2 /100 | #138 | Excellent $88,398 |
| Immigrants | Chile | 89.2 /100 | #139 | Excellent $88,388 |