White/Caucasian vs European Median Household Income
COMPARE
White/Caucasian
European
Median Household Income
Median Household Income Comparison
Whites/Caucasians
Europeans
$82,029
MEDIAN HOUSEHOLD INCOME
12.2/ 100
METRIC RATING
218th/ 347
METRIC RANK
$88,751
MEDIAN HOUSEHOLD INCOME
91.2/ 100
METRIC RATING
132nd/ 347
METRIC RANK
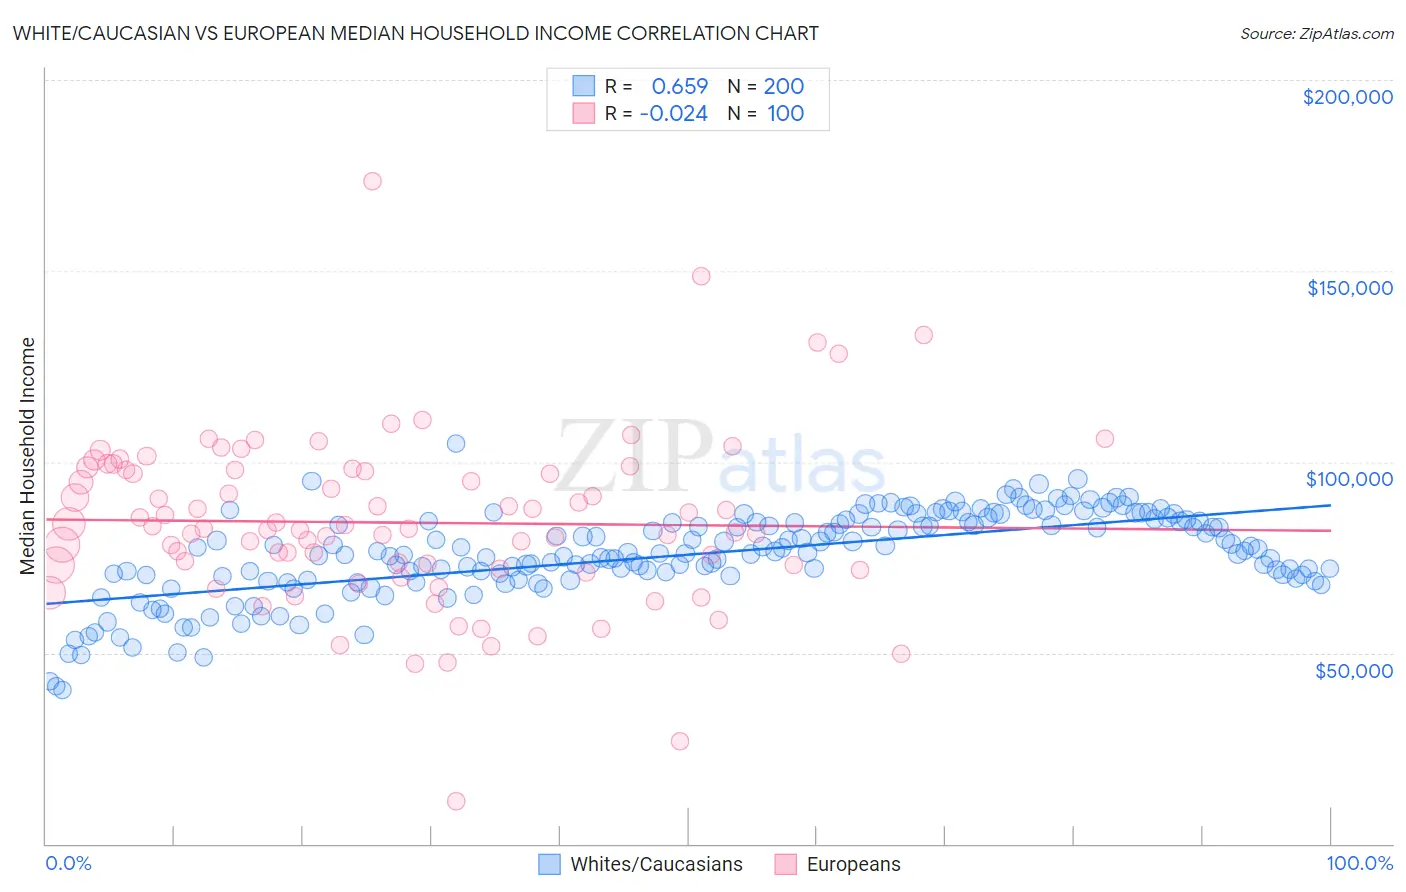
White/Caucasian vs European Median Household Income Correlation Chart
The statistical analysis conducted on geographies consisting of 583,274,044 people shows a significant positive correlation between the proportion of Whites/Caucasians and median household income in the United States with a correlation coefficient (R) of 0.659 and weighted average of $82,029. Similarly, the statistical analysis conducted on geographies consisting of 560,871,034 people shows no correlation between the proportion of Europeans and median household income in the United States with a correlation coefficient (R) of -0.024 and weighted average of $88,751, a difference of 8.2%.
Median Household Income Correlation Summary
| Measurement | White/Caucasian | European |
| Minimum | $40,196 | $11,019 |
| Maximum | $104,886 | $173,396 |
| Range | $64,690 | $162,377 |
| Mean | $75,721 | $84,093 |
| Median | $76,251 | $82,550 |
| Interquartile 25% (IQ1) | $70,055 | $72,512 |
| Interquartile 75% (IQ3) | $84,369 | $97,852 |
| Interquartile Range (IQR) | $14,314 | $25,341 |
| Standard Deviation (Sample) | $11,326 | $22,686 |
| Standard Deviation (Population) | $11,297 | $22,572 |
Similar Demographics by Median Household Income
Demographics Similar to Whites/Caucasians by Median Household Income
In terms of median household income, the demographic groups most similar to Whites/Caucasians are Ecuadorian ($82,070, a difference of 0.050%), Yugoslavian ($82,186, a difference of 0.19%), Vietnamese ($82,248, a difference of 0.27%), Panamanian ($82,272, a difference of 0.30%), and Nigerian ($81,725, a difference of 0.37%).
| Demographics | Rating | Rank | Median Household Income |
| Salvadorans | 15.4 /100 | #211 | Poor $82,449 |
| Venezuelans | 15.3 /100 | #212 | Poor $82,432 |
| Nepalese | 15.1 /100 | #213 | Poor $82,410 |
| Panamanians | 14.0 /100 | #214 | Poor $82,272 |
| Vietnamese | 13.8 /100 | #215 | Poor $82,248 |
| Yugoslavians | 13.3 /100 | #216 | Poor $82,186 |
| Ecuadorians | 12.5 /100 | #217 | Poor $82,070 |
| Whites/Caucasians | 12.2 /100 | #218 | Poor $82,029 |
| Nigerians | 10.3 /100 | #219 | Poor $81,725 |
| Immigrants | Venezuela | 9.0 /100 | #220 | Tragic $81,506 |
| Immigrants | Ghana | 9.0 /100 | #221 | Tragic $81,489 |
| Immigrants | Nigeria | 7.7 /100 | #222 | Tragic $81,236 |
| Immigrants | El Salvador | 7.6 /100 | #223 | Tragic $81,213 |
| Malaysians | 7.0 /100 | #224 | Tragic $81,064 |
| Scotch-Irish | 6.6 /100 | #225 | Tragic $80,972 |
Demographics Similar to Europeans by Median Household Income
In terms of median household income, the demographic groups most similar to Europeans are Immigrants from Syria ($88,792, a difference of 0.050%), Immigrants from Ethiopia ($88,687, a difference of 0.070%), British ($88,914, a difference of 0.18%), Brazilian ($88,934, a difference of 0.21%), and Portuguese ($88,976, a difference of 0.25%).
| Demographics | Rating | Rank | Median Household Income |
| Immigrants | Kuwait | 93.5 /100 | #125 | Exceptional $89,263 |
| Immigrants | Oceania | 92.9 /100 | #126 | Exceptional $89,100 |
| Immigrants | Peru | 92.5 /100 | #127 | Exceptional $89,010 |
| Portuguese | 92.3 /100 | #128 | Exceptional $88,976 |
| Brazilians | 92.1 /100 | #129 | Exceptional $88,934 |
| British | 92.0 /100 | #130 | Exceptional $88,914 |
| Immigrants | Syria | 91.4 /100 | #131 | Exceptional $88,792 |
| Europeans | 91.2 /100 | #132 | Exceptional $88,751 |
| Immigrants | Ethiopia | 90.9 /100 | #133 | Exceptional $88,687 |
| Swedes | 90.0 /100 | #134 | Exceptional $88,524 |
| Immigrants | Sierra Leone | 89.9 /100 | #135 | Excellent $88,498 |
| Poles | 89.7 /100 | #136 | Excellent $88,472 |
| Sierra Leoneans | 89.6 /100 | #137 | Excellent $88,463 |
| Arabs | 89.2 /100 | #138 | Excellent $88,398 |
| Immigrants | Chile | 89.2 /100 | #139 | Excellent $88,388 |