Estonian vs Maltese Wage/Income Gap
COMPARE
Estonian
Maltese
Wage/Income Gap
Wage/Income Gap Comparison
Estonians
Maltese
27.1%
WAGE/INCOME GAP
4.3/ 100
METRIC RATING
239th/ 347
METRIC RANK
28.7%
WAGE/INCOME GAP
0.1/ 100
METRIC RATING
315th/ 347
METRIC RANK
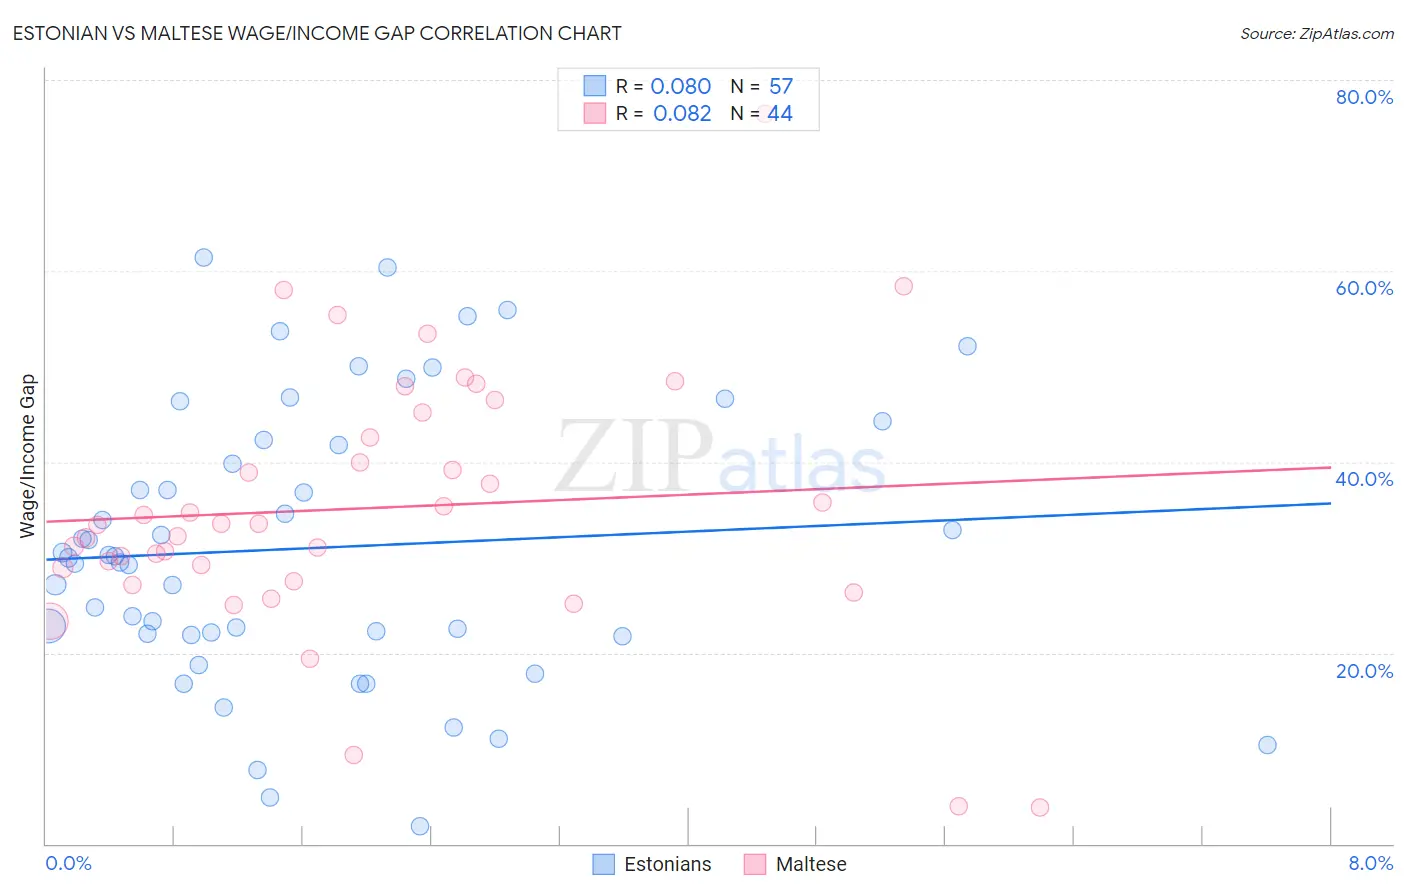
Estonian vs Maltese Wage/Income Gap Correlation Chart
The statistical analysis conducted on geographies consisting of 123,494,549 people shows a slight positive correlation between the proportion of Estonians and wage/income gap percentage in the United States with a correlation coefficient (R) of 0.080 and weighted average of 27.1%. Similarly, the statistical analysis conducted on geographies consisting of 126,452,733 people shows a slight positive correlation between the proportion of Maltese and wage/income gap percentage in the United States with a correlation coefficient (R) of 0.082 and weighted average of 28.7%, a difference of 6.2%.
Wage/Income Gap Correlation Summary
| Measurement | Estonian | Maltese |
| Minimum | 1.9% | 3.8% |
| Maximum | 61.4% | 76.5% |
| Range | 59.5% | 72.8% |
| Mean | 31.0% | 35.2% |
| Median | 29.9% | 33.4% |
| Interquartile 25% (IQ1) | 22.0% | 28.2% |
| Interquartile 75% (IQ3) | 42.0% | 43.9% |
| Interquartile Range (IQR) | 20.1% | 15.7% |
| Standard Deviation (Sample) | 14.4% | 13.9% |
| Standard Deviation (Population) | 14.3% | 13.7% |
Similar Demographics by Wage/Income Gap
Demographics Similar to Estonians by Wage/Income Gap
In terms of wage/income gap, the demographic groups most similar to Estonians are Osage (27.1%, a difference of 0.020%), Immigrants from Eastern Asia (27.1%, a difference of 0.030%), Immigrants from Romania (27.0%, a difference of 0.17%), Immigrants from Europe (27.1%, a difference of 0.18%), and Immigrants from Hungary (27.0%, a difference of 0.19%).
| Demographics | Rating | Rank | Wage/Income Gap |
| Argentineans | 5.2 /100 | #232 | Tragic 27.0% |
| Immigrants | Brazil | 5.0 /100 | #233 | Tragic 27.0% |
| Immigrants | Pakistan | 4.9 /100 | #234 | Tragic 27.0% |
| Immigrants | Hungary | 4.8 /100 | #235 | Tragic 27.0% |
| Immigrants | Romania | 4.8 /100 | #236 | Tragic 27.0% |
| Immigrants | Eastern Asia | 4.4 /100 | #237 | Tragic 27.1% |
| Osage | 4.4 /100 | #238 | Tragic 27.1% |
| Estonians | 4.3 /100 | #239 | Tragic 27.1% |
| Immigrants | Europe | 3.8 /100 | #240 | Tragic 27.1% |
| Creek | 3.8 /100 | #241 | Tragic 27.1% |
| Immigrants | Sri Lanka | 3.7 /100 | #242 | Tragic 27.1% |
| Spanish | 3.6 /100 | #243 | Tragic 27.1% |
| Chickasaw | 3.5 /100 | #244 | Tragic 27.2% |
| Immigrants | Azores | 3.5 /100 | #245 | Tragic 27.2% |
| Immigrants | Nonimmigrants | 3.3 /100 | #246 | Tragic 27.2% |
Demographics Similar to Maltese by Wage/Income Gap
In terms of wage/income gap, the demographic groups most similar to Maltese are Lithuanian (28.7%, a difference of 0.010%), Immigrants from Scotland (28.7%, a difference of 0.050%), Belgian (28.8%, a difference of 0.12%), Basque (28.8%, a difference of 0.17%), and French (28.7%, a difference of 0.19%).
| Demographics | Rating | Rank | Wage/Income Gap |
| Poles | 0.1 /100 | #308 | Tragic 28.5% |
| Macedonians | 0.1 /100 | #309 | Tragic 28.6% |
| Finns | 0.1 /100 | #310 | Tragic 28.6% |
| Immigrants | Lithuania | 0.1 /100 | #311 | Tragic 28.6% |
| Eastern Europeans | 0.1 /100 | #312 | Tragic 28.6% |
| French | 0.1 /100 | #313 | Tragic 28.7% |
| Immigrants | Scotland | 0.1 /100 | #314 | Tragic 28.7% |
| Maltese | 0.1 /100 | #315 | Tragic 28.7% |
| Lithuanians | 0.1 /100 | #316 | Tragic 28.7% |
| Belgians | 0.1 /100 | #317 | Tragic 28.8% |
| Basques | 0.1 /100 | #318 | Tragic 28.8% |
| Slovaks | 0.1 /100 | #319 | Tragic 28.9% |
| British | 0.1 /100 | #320 | Tragic 28.9% |
| Welsh | 0.1 /100 | #321 | Tragic 28.9% |
| Immigrants | Singapore | 0.1 /100 | #322 | Tragic 28.9% |