Egyptian vs Syrian Wage/Income Gap
COMPARE
Egyptian
Syrian
Wage/Income Gap
Wage/Income Gap Comparison
Egyptians
Syrians
26.6%
WAGE/INCOME GAP
12.7/ 100
METRIC RATING
208th/ 347
METRIC RANK
27.6%
WAGE/INCOME GAP
1.4/ 100
METRIC RATING
263rd/ 347
METRIC RANK
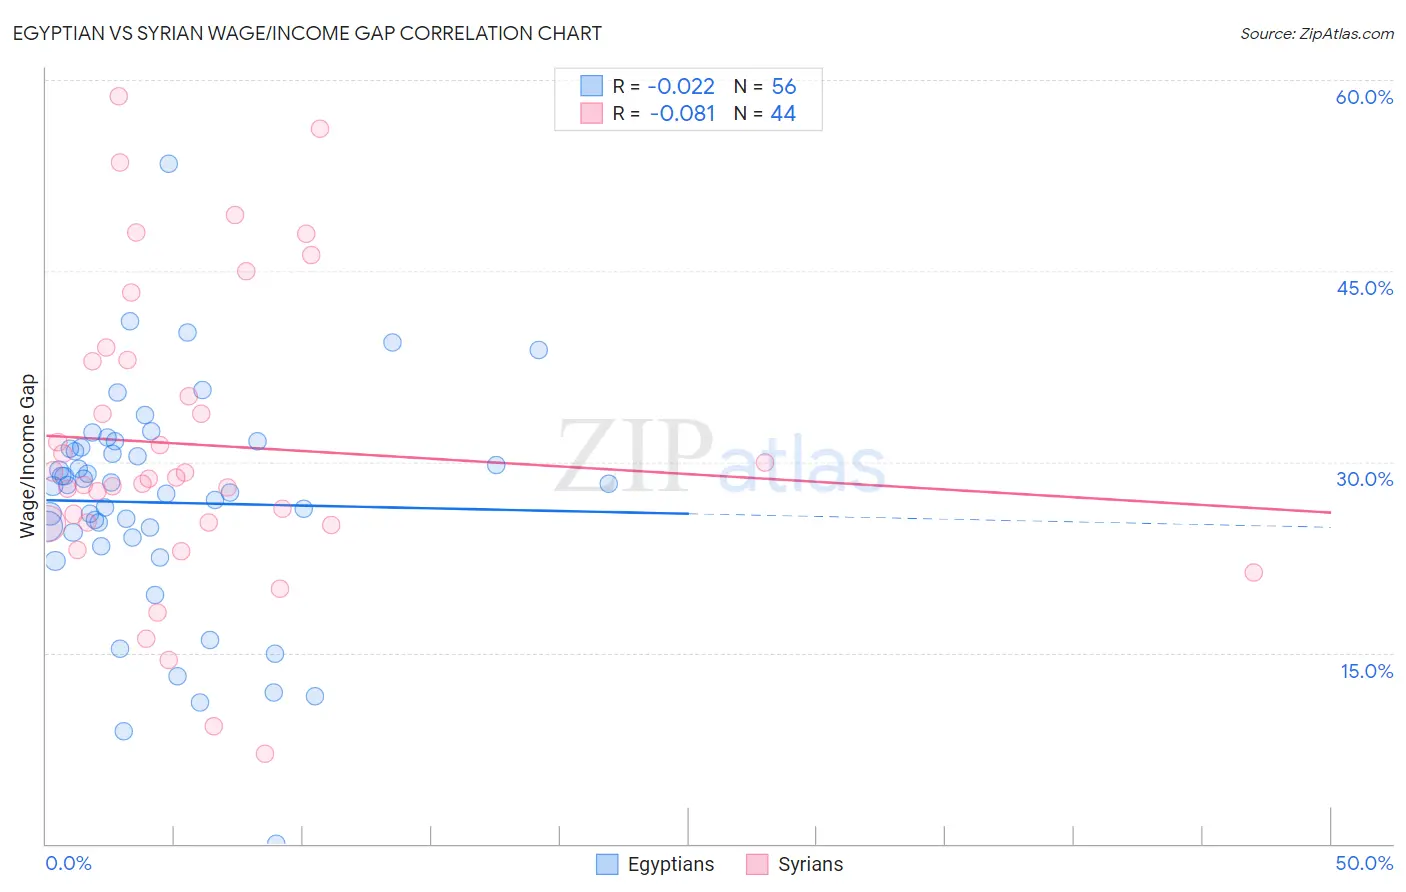
Egyptian vs Syrian Wage/Income Gap Correlation Chart
The statistical analysis conducted on geographies consisting of 276,865,878 people shows no correlation between the proportion of Egyptians and wage/income gap percentage in the United States with a correlation coefficient (R) of -0.022 and weighted average of 26.6%. Similarly, the statistical analysis conducted on geographies consisting of 266,238,667 people shows a slight negative correlation between the proportion of Syrians and wage/income gap percentage in the United States with a correlation coefficient (R) of -0.081 and weighted average of 27.6%, a difference of 3.7%.
Wage/Income Gap Correlation Summary
| Measurement | Egyptian | Syrian |
| Minimum | 0.012% | 7.1% |
| Maximum | 53.4% | 58.7% |
| Range | 53.4% | 51.6% |
| Mean | 26.8% | 31.3% |
| Median | 28.2% | 28.7% |
| Interquartile 25% (IQ1) | 24.3% | 25.2% |
| Interquartile 75% (IQ3) | 31.1% | 38.0% |
| Interquartile Range (IQR) | 6.8% | 12.8% |
| Standard Deviation (Sample) | 8.8% | 11.7% |
| Standard Deviation (Population) | 8.8% | 11.6% |
Similar Demographics by Wage/Income Gap
Demographics Similar to Egyptians by Wage/Income Gap
In terms of wage/income gap, the demographic groups most similar to Egyptians are Immigrants from Kuwait (26.6%, a difference of 0.020%), Arab (26.6%, a difference of 0.060%), Mongolian (26.6%, a difference of 0.19%), Iraqi (26.6%, a difference of 0.22%), and Immigrants from Iraq (26.7%, a difference of 0.37%).
| Demographics | Rating | Rank | Wage/Income Gap |
| Immigrants | Syria | 19.3 /100 | #201 | Poor 26.4% |
| Laotians | 19.2 /100 | #202 | Poor 26.4% |
| Immigrants | Eastern Europe | 19.2 /100 | #203 | Poor 26.4% |
| Immigrants | Russia | 19.0 /100 | #204 | Poor 26.4% |
| Immigrants | Southern Europe | 17.3 /100 | #205 | Poor 26.4% |
| Indians (Asian) | 16.5 /100 | #206 | Poor 26.4% |
| Immigrants | Italy | 15.8 /100 | #207 | Poor 26.5% |
| Egyptians | 12.7 /100 | #208 | Poor 26.6% |
| Immigrants | Kuwait | 12.6 /100 | #209 | Poor 26.6% |
| Arabs | 12.3 /100 | #210 | Poor 26.6% |
| Mongolians | 11.4 /100 | #211 | Poor 26.6% |
| Iraqis | 11.2 /100 | #212 | Poor 26.6% |
| Immigrants | Iraq | 10.3 /100 | #213 | Poor 26.7% |
| Immigrants | China | 10.3 /100 | #214 | Poor 26.7% |
| Yugoslavians | 9.7 /100 | #215 | Tragic 26.7% |
Demographics Similar to Syrians by Wage/Income Gap
In terms of wage/income gap, the demographic groups most similar to Syrians are Immigrants from Lebanon (27.5%, a difference of 0.090%), Immigrants from Germany (27.5%, a difference of 0.10%), Tongan (27.5%, a difference of 0.37%), Icelander (27.5%, a difference of 0.38%), and Immigrants from Switzerland (27.7%, a difference of 0.45%).
| Demographics | Rating | Rank | Wage/Income Gap |
| Cherokee | 1.9 /100 | #256 | Tragic 27.4% |
| Luxembourgers | 1.9 /100 | #257 | Tragic 27.4% |
| Slavs | 1.8 /100 | #258 | Tragic 27.4% |
| Icelanders | 1.8 /100 | #259 | Tragic 27.5% |
| Tongans | 1.7 /100 | #260 | Tragic 27.5% |
| Immigrants | Germany | 1.5 /100 | #261 | Tragic 27.5% |
| Immigrants | Lebanon | 1.5 /100 | #262 | Tragic 27.5% |
| Syrians | 1.4 /100 | #263 | Tragic 27.6% |
| Immigrants | Switzerland | 1.0 /100 | #264 | Tragic 27.7% |
| Serbians | 1.0 /100 | #265 | Tragic 27.7% |
| Hmong | 1.0 /100 | #266 | Tragic 27.7% |
| Turks | 1.0 /100 | #267 | Tragic 27.7% |
| New Zealanders | 1.0 /100 | #268 | Tragic 27.7% |
| Potawatomi | 0.9 /100 | #269 | Tragic 27.7% |
| Immigrants | Western Europe | 0.9 /100 | #270 | Tragic 27.8% |