Belgian vs Syrian Wage/Income Gap
COMPARE
Belgian
Syrian
Wage/Income Gap
Wage/Income Gap Comparison
Belgians
Syrians
28.8%
WAGE/INCOME GAP
0.1/ 100
METRIC RATING
317th/ 347
METRIC RANK
27.6%
WAGE/INCOME GAP
1.4/ 100
METRIC RATING
263rd/ 347
METRIC RANK
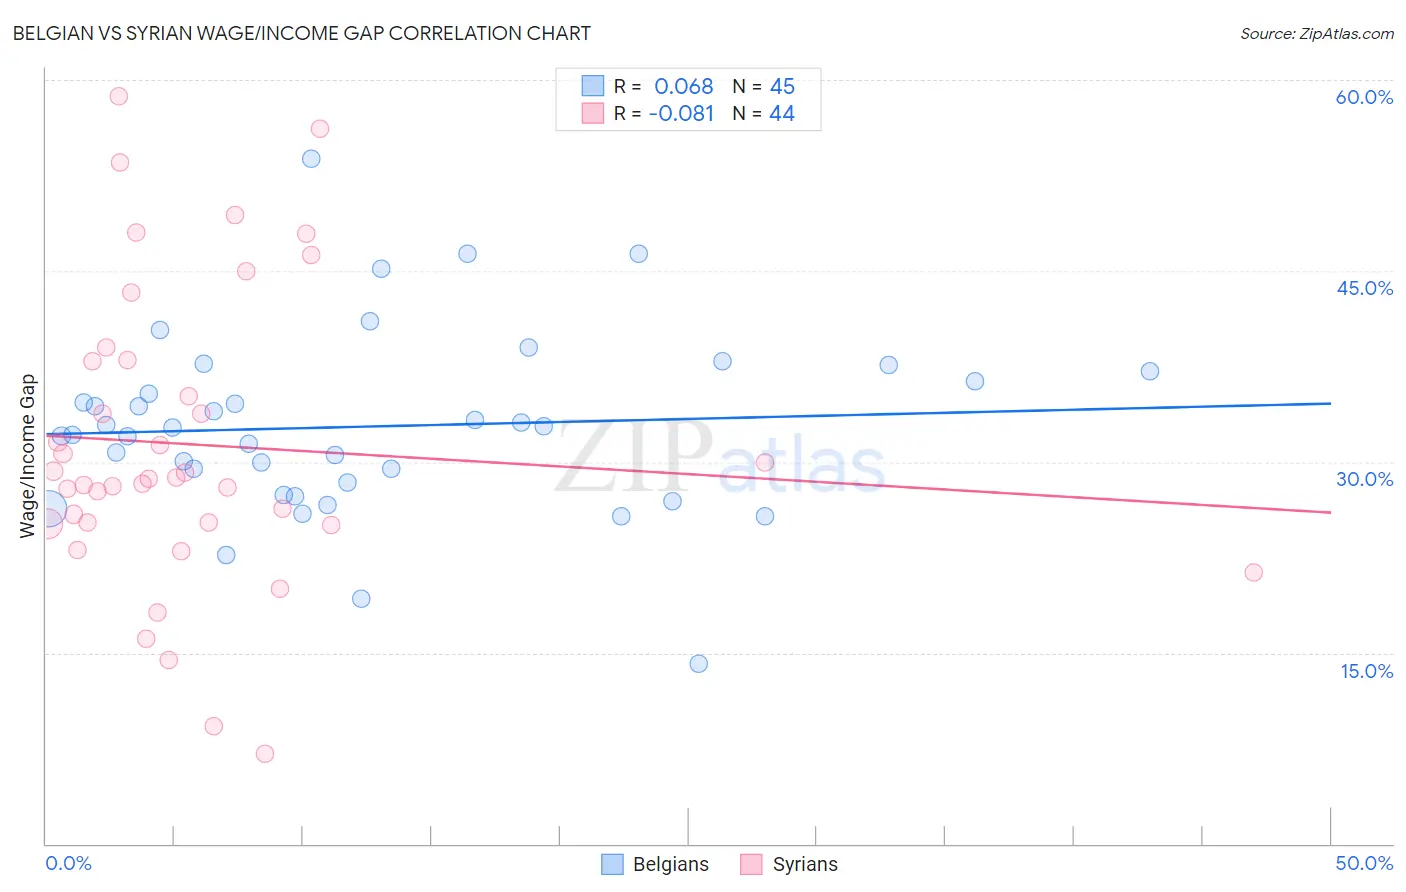
Belgian vs Syrian Wage/Income Gap Correlation Chart
The statistical analysis conducted on geographies consisting of 355,768,558 people shows a slight positive correlation between the proportion of Belgians and wage/income gap percentage in the United States with a correlation coefficient (R) of 0.068 and weighted average of 28.8%. Similarly, the statistical analysis conducted on geographies consisting of 266,238,667 people shows a slight negative correlation between the proportion of Syrians and wage/income gap percentage in the United States with a correlation coefficient (R) of -0.081 and weighted average of 27.6%, a difference of 4.4%.
Wage/Income Gap Correlation Summary
| Measurement | Belgian | Syrian |
| Minimum | 14.1% | 7.1% |
| Maximum | 53.8% | 58.7% |
| Range | 39.7% | 51.6% |
| Mean | 32.8% | 31.3% |
| Median | 32.7% | 28.7% |
| Interquartile 25% (IQ1) | 27.9% | 25.2% |
| Interquartile 75% (IQ3) | 36.7% | 38.0% |
| Interquartile Range (IQR) | 8.8% | 12.8% |
| Standard Deviation (Sample) | 7.2% | 11.7% |
| Standard Deviation (Population) | 7.1% | 11.6% |
Similar Demographics by Wage/Income Gap
Demographics Similar to Belgians by Wage/Income Gap
In terms of wage/income gap, the demographic groups most similar to Belgians are Basque (28.8%, a difference of 0.050%), Lithuanian (28.7%, a difference of 0.11%), Maltese (28.7%, a difference of 0.12%), Immigrants from Scotland (28.7%, a difference of 0.17%), and French (28.7%, a difference of 0.32%).
| Demographics | Rating | Rank | Wage/Income Gap |
| Finns | 0.1 /100 | #310 | Tragic 28.6% |
| Immigrants | Lithuania | 0.1 /100 | #311 | Tragic 28.6% |
| Eastern Europeans | 0.1 /100 | #312 | Tragic 28.6% |
| French | 0.1 /100 | #313 | Tragic 28.7% |
| Immigrants | Scotland | 0.1 /100 | #314 | Tragic 28.7% |
| Maltese | 0.1 /100 | #315 | Tragic 28.7% |
| Lithuanians | 0.1 /100 | #316 | Tragic 28.7% |
| Belgians | 0.1 /100 | #317 | Tragic 28.8% |
| Basques | 0.1 /100 | #318 | Tragic 28.8% |
| Slovaks | 0.1 /100 | #319 | Tragic 28.9% |
| British | 0.1 /100 | #320 | Tragic 28.9% |
| Welsh | 0.1 /100 | #321 | Tragic 28.9% |
| Immigrants | Singapore | 0.1 /100 | #322 | Tragic 28.9% |
| Norwegians | 0.1 /100 | #323 | Tragic 29.0% |
| Croatians | 0.0 /100 | #324 | Tragic 29.0% |
Demographics Similar to Syrians by Wage/Income Gap
In terms of wage/income gap, the demographic groups most similar to Syrians are Immigrants from Lebanon (27.5%, a difference of 0.090%), Immigrants from Germany (27.5%, a difference of 0.10%), Tongan (27.5%, a difference of 0.37%), Icelander (27.5%, a difference of 0.38%), and Immigrants from Switzerland (27.7%, a difference of 0.45%).
| Demographics | Rating | Rank | Wage/Income Gap |
| Cherokee | 1.9 /100 | #256 | Tragic 27.4% |
| Luxembourgers | 1.9 /100 | #257 | Tragic 27.4% |
| Slavs | 1.8 /100 | #258 | Tragic 27.4% |
| Icelanders | 1.8 /100 | #259 | Tragic 27.5% |
| Tongans | 1.7 /100 | #260 | Tragic 27.5% |
| Immigrants | Germany | 1.5 /100 | #261 | Tragic 27.5% |
| Immigrants | Lebanon | 1.5 /100 | #262 | Tragic 27.5% |
| Syrians | 1.4 /100 | #263 | Tragic 27.6% |
| Immigrants | Switzerland | 1.0 /100 | #264 | Tragic 27.7% |
| Serbians | 1.0 /100 | #265 | Tragic 27.7% |
| Hmong | 1.0 /100 | #266 | Tragic 27.7% |
| Turks | 1.0 /100 | #267 | Tragic 27.7% |
| New Zealanders | 1.0 /100 | #268 | Tragic 27.7% |
| Potawatomi | 0.9 /100 | #269 | Tragic 27.7% |
| Immigrants | Western Europe | 0.9 /100 | #270 | Tragic 27.8% |