Egyptian vs Immigrants from the Azores Wage/Income Gap
COMPARE
Egyptian
Immigrants from the Azores
Wage/Income Gap
Wage/Income Gap Comparison
Egyptians
Immigrants from the Azores
26.6%
WAGE/INCOME GAP
12.7/ 100
METRIC RATING
208th/ 347
METRIC RANK
27.2%
WAGE/INCOME GAP
3.5/ 100
METRIC RATING
245th/ 347
METRIC RANK
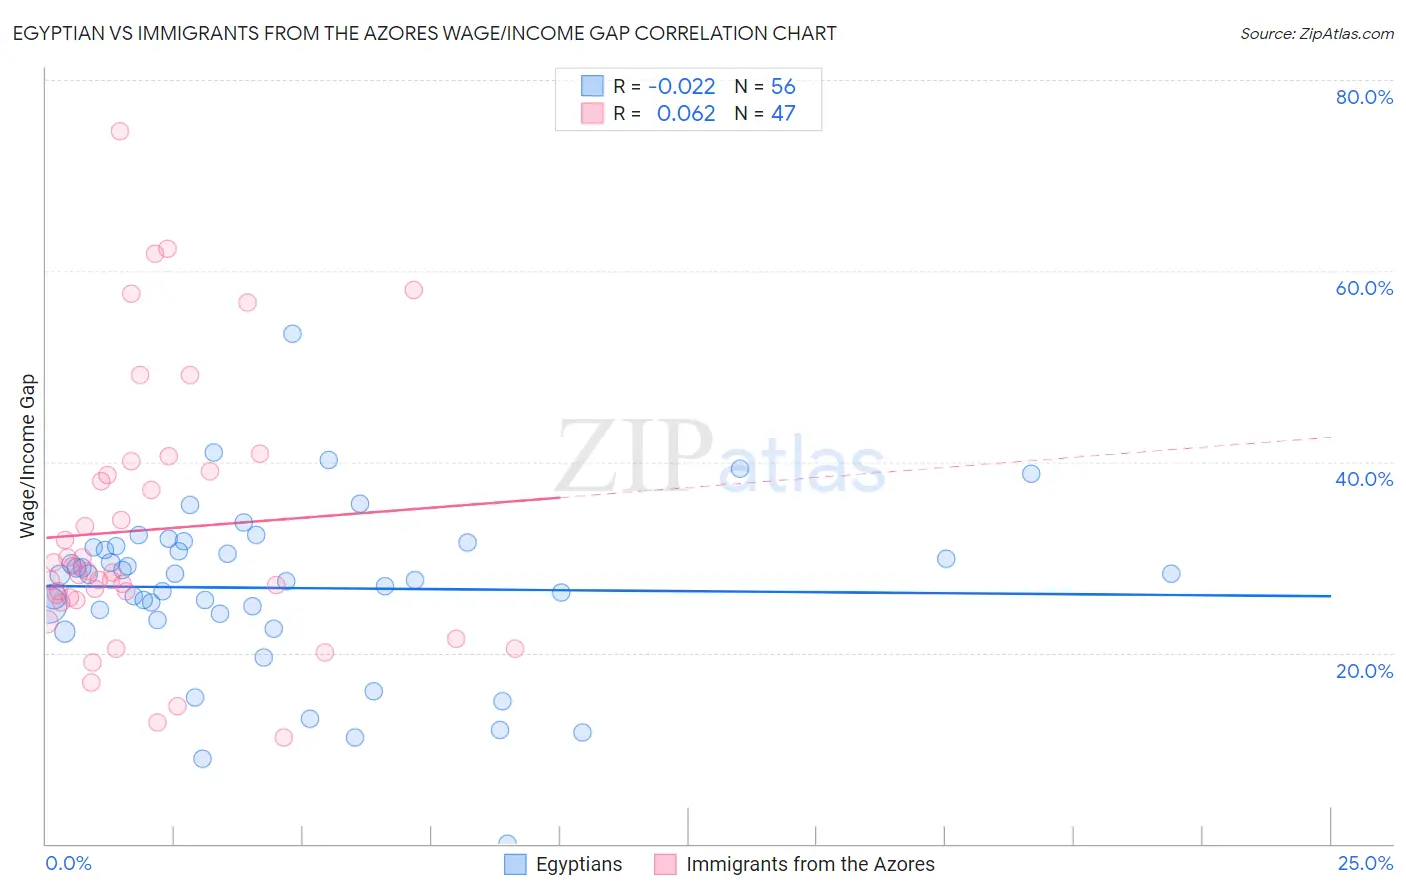
Egyptian vs Immigrants from the Azores Wage/Income Gap Correlation Chart
The statistical analysis conducted on geographies consisting of 276,865,878 people shows no correlation between the proportion of Egyptians and wage/income gap percentage in the United States with a correlation coefficient (R) of -0.022 and weighted average of 26.6%. Similarly, the statistical analysis conducted on geographies consisting of 46,247,590 people shows a slight positive correlation between the proportion of Immigrants from the Azores and wage/income gap percentage in the United States with a correlation coefficient (R) of 0.062 and weighted average of 27.2%, a difference of 2.2%.
Wage/Income Gap Correlation Summary
| Measurement | Egyptian | Immigrants from the Azores |
| Minimum | 0.012% | 11.1% |
| Maximum | 53.4% | 74.6% |
| Range | 53.4% | 63.5% |
| Mean | 26.8% | 32.9% |
| Median | 28.2% | 28.4% |
| Interquartile 25% (IQ1) | 24.3% | 25.6% |
| Interquartile 75% (IQ3) | 31.1% | 39.0% |
| Interquartile Range (IQR) | 6.8% | 13.4% |
| Standard Deviation (Sample) | 8.8% | 14.0% |
| Standard Deviation (Population) | 8.8% | 13.8% |
Similar Demographics by Wage/Income Gap
Demographics Similar to Egyptians by Wage/Income Gap
In terms of wage/income gap, the demographic groups most similar to Egyptians are Immigrants from Kuwait (26.6%, a difference of 0.020%), Arab (26.6%, a difference of 0.060%), Mongolian (26.6%, a difference of 0.19%), Iraqi (26.6%, a difference of 0.22%), and Immigrants from Iraq (26.7%, a difference of 0.37%).
| Demographics | Rating | Rank | Wage/Income Gap |
| Immigrants | Syria | 19.3 /100 | #201 | Poor 26.4% |
| Laotians | 19.2 /100 | #202 | Poor 26.4% |
| Immigrants | Eastern Europe | 19.2 /100 | #203 | Poor 26.4% |
| Immigrants | Russia | 19.0 /100 | #204 | Poor 26.4% |
| Immigrants | Southern Europe | 17.3 /100 | #205 | Poor 26.4% |
| Indians (Asian) | 16.5 /100 | #206 | Poor 26.4% |
| Immigrants | Italy | 15.8 /100 | #207 | Poor 26.5% |
| Egyptians | 12.7 /100 | #208 | Poor 26.6% |
| Immigrants | Kuwait | 12.6 /100 | #209 | Poor 26.6% |
| Arabs | 12.3 /100 | #210 | Poor 26.6% |
| Mongolians | 11.4 /100 | #211 | Poor 26.6% |
| Iraqis | 11.2 /100 | #212 | Poor 26.6% |
| Immigrants | Iraq | 10.3 /100 | #213 | Poor 26.7% |
| Immigrants | China | 10.3 /100 | #214 | Poor 26.7% |
| Yugoslavians | 9.7 /100 | #215 | Tragic 26.7% |
Demographics Similar to Immigrants from the Azores by Wage/Income Gap
In terms of wage/income gap, the demographic groups most similar to Immigrants from the Azores are Chickasaw (27.2%, a difference of 0.020%), Nonimmigrants (27.2%, a difference of 0.080%), Immigrants from Sri Lanka (27.1%, a difference of 0.090%), Spanish (27.1%, a difference of 0.090%), and Creek (27.1%, a difference of 0.14%).
| Demographics | Rating | Rank | Wage/Income Gap |
| Osage | 4.4 /100 | #238 | Tragic 27.1% |
| Estonians | 4.3 /100 | #239 | Tragic 27.1% |
| Immigrants | Europe | 3.8 /100 | #240 | Tragic 27.1% |
| Creek | 3.8 /100 | #241 | Tragic 27.1% |
| Immigrants | Sri Lanka | 3.7 /100 | #242 | Tragic 27.1% |
| Spanish | 3.6 /100 | #243 | Tragic 27.1% |
| Chickasaw | 3.5 /100 | #244 | Tragic 27.2% |
| Immigrants | Azores | 3.5 /100 | #245 | Tragic 27.2% |
| Immigrants | Nonimmigrants | 3.3 /100 | #246 | Tragic 27.2% |
| Celtics | 2.8 /100 | #247 | Tragic 27.3% |
| Cypriots | 2.8 /100 | #248 | Tragic 27.3% |
| Carpatho Rusyns | 2.7 /100 | #249 | Tragic 27.3% |
| Immigrants | Czechoslovakia | 2.7 /100 | #250 | Tragic 27.3% |
| Immigrants | Norway | 2.5 /100 | #251 | Tragic 27.3% |
| Ukrainians | 2.4 /100 | #252 | Tragic 27.3% |