Egyptian vs Immigrants from Jordan Wage/Income Gap
COMPARE
Egyptian
Immigrants from Jordan
Wage/Income Gap
Wage/Income Gap Comparison
Egyptians
Immigrants from Jordan
26.6%
WAGE/INCOME GAP
12.7/ 100
METRIC RATING
208th/ 347
METRIC RANK
26.3%
WAGE/INCOME GAP
22.4/ 100
METRIC RATING
193rd/ 347
METRIC RANK
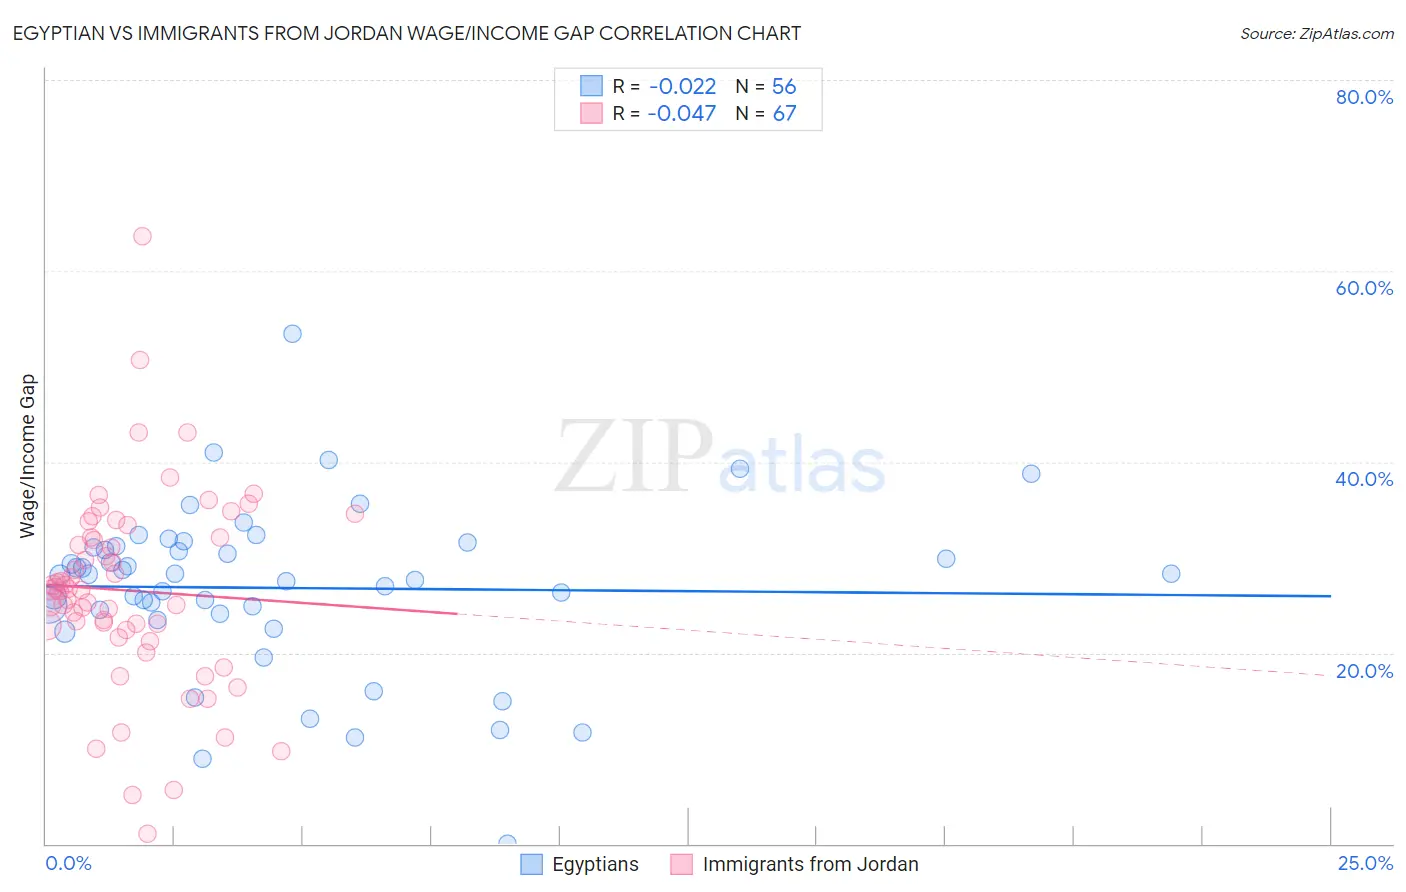
Egyptian vs Immigrants from Jordan Wage/Income Gap Correlation Chart
The statistical analysis conducted on geographies consisting of 276,865,878 people shows no correlation between the proportion of Egyptians and wage/income gap percentage in the United States with a correlation coefficient (R) of -0.022 and weighted average of 26.6%. Similarly, the statistical analysis conducted on geographies consisting of 181,259,596 people shows no correlation between the proportion of Immigrants from Jordan and wage/income gap percentage in the United States with a correlation coefficient (R) of -0.047 and weighted average of 26.3%, a difference of 1.1%.
Wage/Income Gap Correlation Summary
| Measurement | Egyptian | Immigrants from Jordan |
| Minimum | 0.012% | 1.1% |
| Maximum | 53.4% | 63.6% |
| Range | 53.4% | 62.5% |
| Mean | 26.8% | 26.5% |
| Median | 28.2% | 26.6% |
| Interquartile 25% (IQ1) | 24.3% | 22.3% |
| Interquartile 75% (IQ3) | 31.1% | 32.1% |
| Interquartile Range (IQR) | 6.8% | 9.7% |
| Standard Deviation (Sample) | 8.8% | 10.3% |
| Standard Deviation (Population) | 8.8% | 10.2% |
Demographics Similar to Egyptians and Immigrants from Jordan by Wage/Income Gap
In terms of wage/income gap, the demographic groups most similar to Egyptians are Immigrants from Kuwait (26.6%, a difference of 0.020%), Arab (26.6%, a difference of 0.060%), Immigrants from Italy (26.5%, a difference of 0.41%), Indian (Asian) (26.4%, a difference of 0.49%), and Immigrants from Southern Europe (26.4%, a difference of 0.58%). Similarly, the demographic groups most similar to Immigrants from Jordan are Chilean (26.3%, a difference of 0.0%), Immigrants from Bulgaria (26.3%, a difference of 0.020%), Immigrants from Malaysia (26.3%, a difference of 0.020%), Immigrants from Western Asia (26.3%, a difference of 0.060%), and Zimbabwean (26.3%, a difference of 0.070%).
| Demographics | Rating | Rank | Wage/Income Gap |
| Immigrants | Croatia | 24.8 /100 | #190 | Fair 26.2% |
| Immigrants | Venezuela | 24.7 /100 | #191 | Fair 26.2% |
| Immigrants | Bulgaria | 22.5 /100 | #192 | Fair 26.3% |
| Immigrants | Jordan | 22.4 /100 | #193 | Fair 26.3% |
| Chileans | 22.3 /100 | #194 | Fair 26.3% |
| Immigrants | Malaysia | 22.2 /100 | #195 | Fair 26.3% |
| Immigrants | Western Asia | 21.7 /100 | #196 | Fair 26.3% |
| Zimbabweans | 21.6 /100 | #197 | Fair 26.3% |
| Venezuelans | 21.5 /100 | #198 | Fair 26.3% |
| Dutch West Indians | 21.0 /100 | #199 | Fair 26.3% |
| Delaware | 20.9 /100 | #200 | Fair 26.3% |
| Immigrants | Syria | 19.3 /100 | #201 | Poor 26.4% |
| Laotians | 19.2 /100 | #202 | Poor 26.4% |
| Immigrants | Eastern Europe | 19.2 /100 | #203 | Poor 26.4% |
| Immigrants | Russia | 19.0 /100 | #204 | Poor 26.4% |
| Immigrants | Southern Europe | 17.3 /100 | #205 | Poor 26.4% |
| Indians (Asian) | 16.5 /100 | #206 | Poor 26.4% |
| Immigrants | Italy | 15.8 /100 | #207 | Poor 26.5% |
| Egyptians | 12.7 /100 | #208 | Poor 26.6% |
| Immigrants | Kuwait | 12.6 /100 | #209 | Poor 26.6% |
| Arabs | 12.3 /100 | #210 | Poor 26.6% |