Ecuadorian vs Immigrants from Sri Lanka Median Earnings
COMPARE
Ecuadorian
Immigrants from Sri Lanka
Median Earnings
Median Earnings Comparison
Ecuadorians
Immigrants from Sri Lanka
$45,214
MEDIAN EARNINGS
15.3/ 100
METRIC RATING
220th/ 347
METRIC RANK
$53,268
MEDIAN EARNINGS
100.0/ 100
METRIC RATING
34th/ 347
METRIC RANK
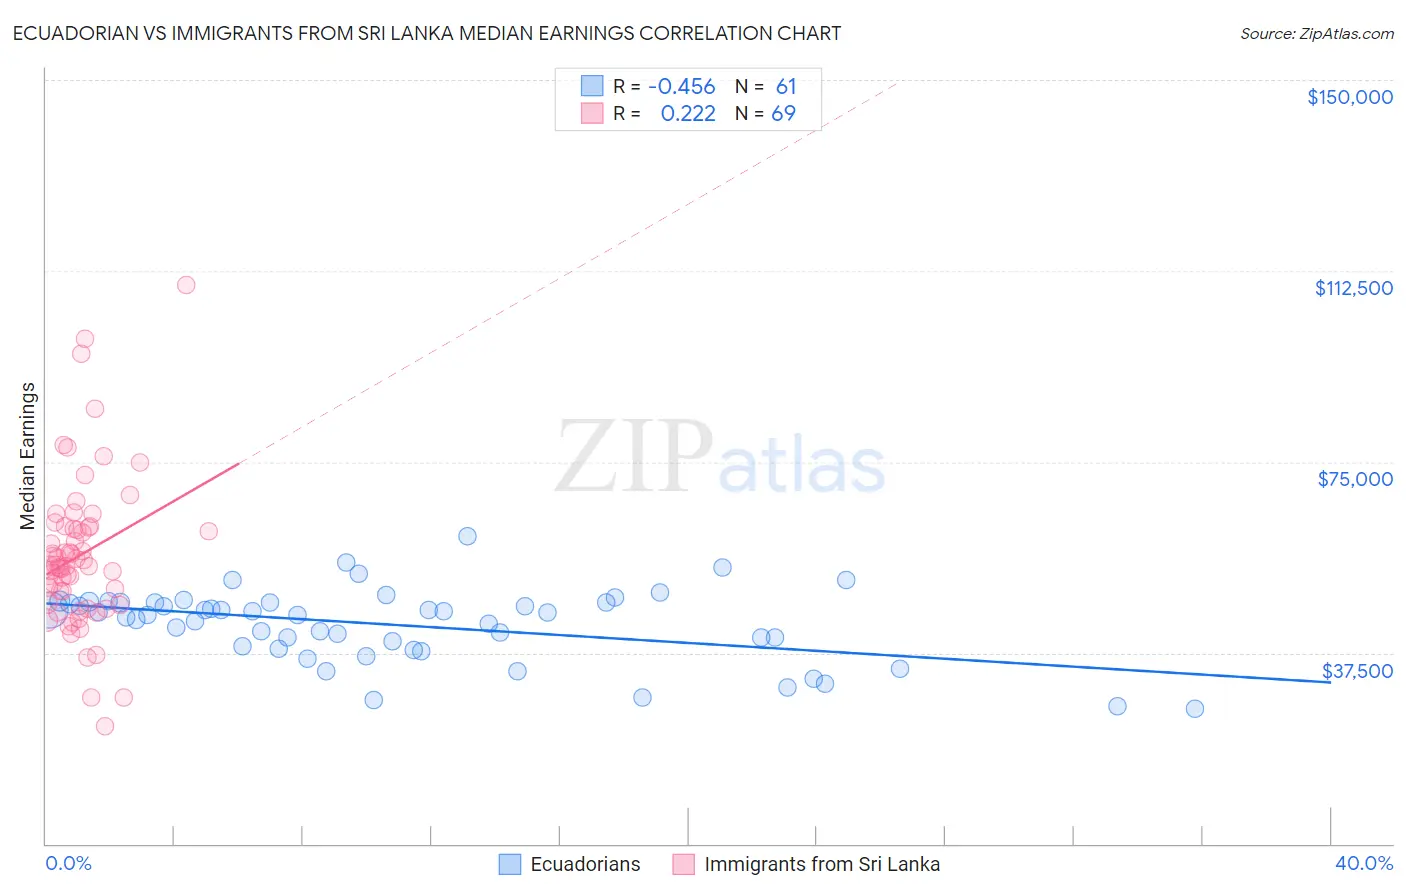
Ecuadorian vs Immigrants from Sri Lanka Median Earnings Correlation Chart
The statistical analysis conducted on geographies consisting of 317,848,977 people shows a moderate negative correlation between the proportion of Ecuadorians and median earnings in the United States with a correlation coefficient (R) of -0.456 and weighted average of $45,214. Similarly, the statistical analysis conducted on geographies consisting of 149,698,351 people shows a weak positive correlation between the proportion of Immigrants from Sri Lanka and median earnings in the United States with a correlation coefficient (R) of 0.222 and weighted average of $53,268, a difference of 17.8%.
Median Earnings Correlation Summary
| Measurement | Ecuadorian | Immigrants from Sri Lanka |
| Minimum | $26,500 | $23,025 |
| Maximum | $60,377 | $109,620 |
| Range | $33,877 | $86,595 |
| Mean | $42,954 | $56,667 |
| Median | $45,047 | $54,686 |
| Interquartile 25% (IQ1) | $38,574 | $47,118 |
| Interquartile 75% (IQ3) | $47,434 | $62,136 |
| Interquartile Range (IQR) | $8,860 | $15,018 |
| Standard Deviation (Sample) | $7,114 | $15,005 |
| Standard Deviation (Population) | $7,055 | $14,895 |
Similar Demographics by Median Earnings
Demographics Similar to Ecuadorians by Median Earnings
In terms of median earnings, the demographic groups most similar to Ecuadorians are Immigrants from Guyana ($45,204, a difference of 0.020%), Immigrants from Panama ($45,198, a difference of 0.030%), White/Caucasian ($45,197, a difference of 0.040%), West Indian ($45,132, a difference of 0.18%), and Immigrants from Cambodia ($45,090, a difference of 0.28%).
| Demographics | Rating | Rank | Median Earnings |
| Immigrants | Colombia | 22.4 /100 | #213 | Fair $45,550 |
| Nigerians | 22.0 /100 | #214 | Fair $45,532 |
| Immigrants | Bangladesh | 22.0 /100 | #215 | Fair $45,532 |
| Guyanese | 20.6 /100 | #216 | Fair $45,470 |
| Tlingit-Haida | 20.5 /100 | #217 | Fair $45,468 |
| Spanish | 19.7 /100 | #218 | Poor $45,432 |
| Dutch | 18.4 /100 | #219 | Poor $45,370 |
| Ecuadorians | 15.3 /100 | #220 | Poor $45,214 |
| Immigrants | Guyana | 15.1 /100 | #221 | Poor $45,204 |
| Immigrants | Panama | 15.0 /100 | #222 | Poor $45,198 |
| Whites/Caucasians | 15.0 /100 | #223 | Poor $45,197 |
| West Indians | 13.9 /100 | #224 | Poor $45,132 |
| Immigrants | Cambodia | 13.2 /100 | #225 | Poor $45,090 |
| Immigrants | Nigeria | 12.2 /100 | #226 | Poor $45,030 |
| Native Hawaiians | 12.2 /100 | #227 | Poor $45,027 |
Demographics Similar to Immigrants from Sri Lanka by Median Earnings
In terms of median earnings, the demographic groups most similar to Immigrants from Sri Lanka are Immigrants from Greece ($53,282, a difference of 0.030%), Immigrants from Asia ($53,310, a difference of 0.080%), Immigrants from Switzerland ($53,211, a difference of 0.11%), Russian ($53,334, a difference of 0.12%), and Immigrants from Denmark ($53,186, a difference of 0.15%).
| Demographics | Rating | Rank | Median Earnings |
| Asians | 100.0 /100 | #27 | Exceptional $53,690 |
| Immigrants | France | 100.0 /100 | #28 | Exceptional $53,490 |
| Immigrants | Russia | 100.0 /100 | #29 | Exceptional $53,457 |
| Cambodians | 100.0 /100 | #30 | Exceptional $53,386 |
| Russians | 100.0 /100 | #31 | Exceptional $53,334 |
| Immigrants | Asia | 100.0 /100 | #32 | Exceptional $53,310 |
| Immigrants | Greece | 100.0 /100 | #33 | Exceptional $53,282 |
| Immigrants | Sri Lanka | 100.0 /100 | #34 | Exceptional $53,268 |
| Immigrants | Switzerland | 100.0 /100 | #35 | Exceptional $53,211 |
| Immigrants | Denmark | 100.0 /100 | #36 | Exceptional $53,186 |
| Immigrants | Belarus | 100.0 /100 | #37 | Exceptional $53,043 |
| Latvians | 100.0 /100 | #38 | Exceptional $53,001 |
| Immigrants | Turkey | 100.0 /100 | #39 | Exceptional $52,960 |
| Israelis | 100.0 /100 | #40 | Exceptional $52,937 |
| Immigrants | Lithuania | 100.0 /100 | #41 | Exceptional $52,769 |