Ecuadorian vs Immigrants from Dominican Republic Median Earnings
COMPARE
Ecuadorian
Immigrants from Dominican Republic
Median Earnings
Median Earnings Comparison
Ecuadorians
Immigrants from Dominican Republic
$45,214
MEDIAN EARNINGS
15.3/ 100
METRIC RATING
220th/ 347
METRIC RANK
$41,554
MEDIAN EARNINGS
0.1/ 100
METRIC RATING
288th/ 347
METRIC RANK
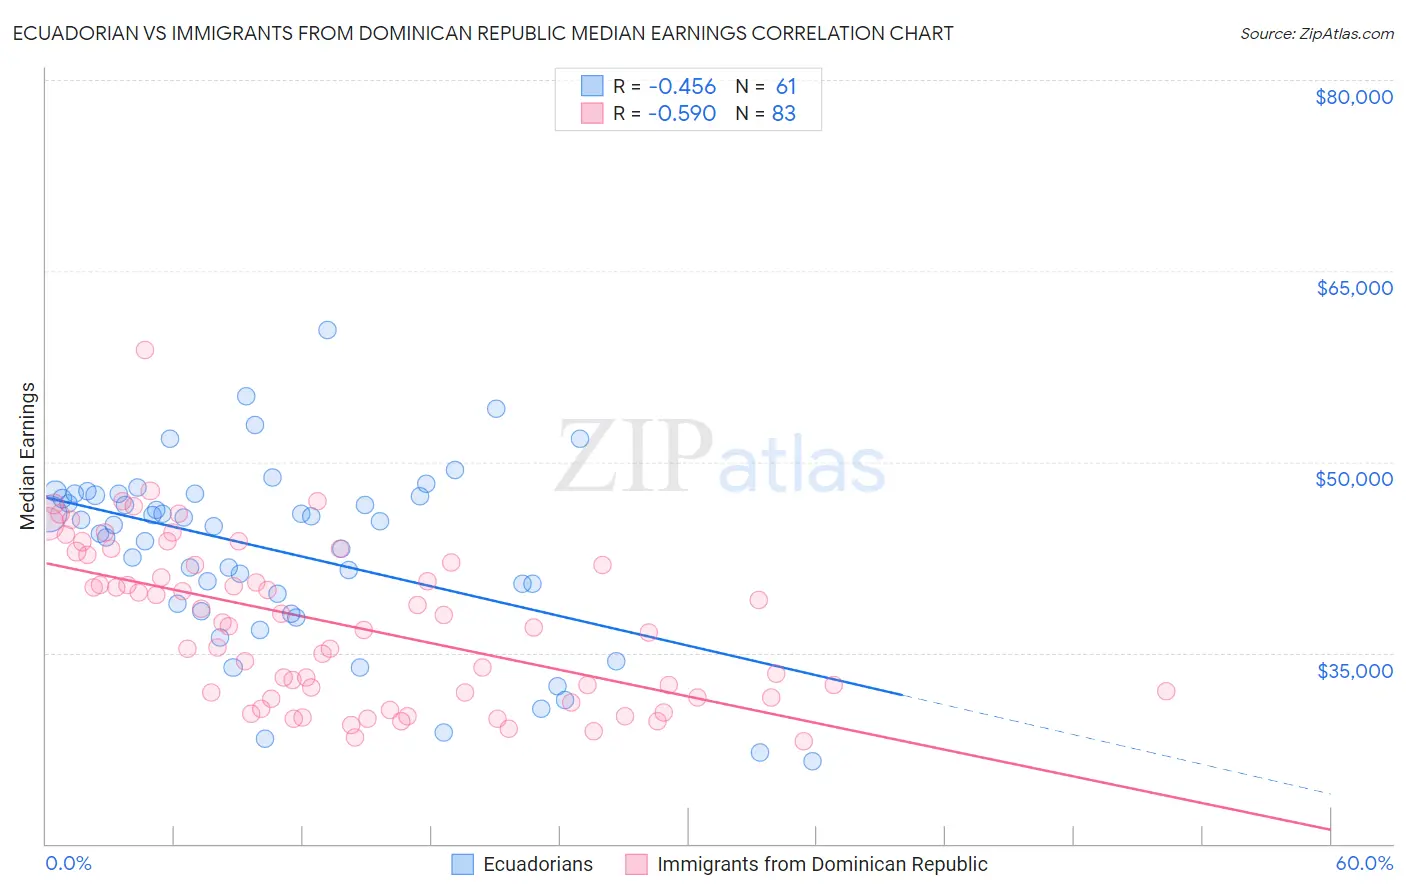
Ecuadorian vs Immigrants from Dominican Republic Median Earnings Correlation Chart
The statistical analysis conducted on geographies consisting of 317,848,977 people shows a moderate negative correlation between the proportion of Ecuadorians and median earnings in the United States with a correlation coefficient (R) of -0.456 and weighted average of $45,214. Similarly, the statistical analysis conducted on geographies consisting of 275,134,235 people shows a substantial negative correlation between the proportion of Immigrants from Dominican Republic and median earnings in the United States with a correlation coefficient (R) of -0.590 and weighted average of $41,554, a difference of 8.8%.
Median Earnings Correlation Summary
| Measurement | Ecuadorian | Immigrants from Dominican Republic |
| Minimum | $26,500 | $28,009 |
| Maximum | $60,377 | $58,780 |
| Range | $33,877 | $30,771 |
| Mean | $42,954 | $37,276 |
| Median | $45,047 | $37,042 |
| Interquartile 25% (IQ1) | $38,574 | $31,535 |
| Interquartile 75% (IQ3) | $47,434 | $42,082 |
| Interquartile Range (IQR) | $8,860 | $10,547 |
| Standard Deviation (Sample) | $7,114 | $6,269 |
| Standard Deviation (Population) | $7,055 | $6,231 |
Similar Demographics by Median Earnings
Demographics Similar to Ecuadorians by Median Earnings
In terms of median earnings, the demographic groups most similar to Ecuadorians are Immigrants from Guyana ($45,204, a difference of 0.020%), Immigrants from Panama ($45,198, a difference of 0.030%), White/Caucasian ($45,197, a difference of 0.040%), West Indian ($45,132, a difference of 0.18%), and Immigrants from Cambodia ($45,090, a difference of 0.28%).
| Demographics | Rating | Rank | Median Earnings |
| Immigrants | Colombia | 22.4 /100 | #213 | Fair $45,550 |
| Nigerians | 22.0 /100 | #214 | Fair $45,532 |
| Immigrants | Bangladesh | 22.0 /100 | #215 | Fair $45,532 |
| Guyanese | 20.6 /100 | #216 | Fair $45,470 |
| Tlingit-Haida | 20.5 /100 | #217 | Fair $45,468 |
| Spanish | 19.7 /100 | #218 | Poor $45,432 |
| Dutch | 18.4 /100 | #219 | Poor $45,370 |
| Ecuadorians | 15.3 /100 | #220 | Poor $45,214 |
| Immigrants | Guyana | 15.1 /100 | #221 | Poor $45,204 |
| Immigrants | Panama | 15.0 /100 | #222 | Poor $45,198 |
| Whites/Caucasians | 15.0 /100 | #223 | Poor $45,197 |
| West Indians | 13.9 /100 | #224 | Poor $45,132 |
| Immigrants | Cambodia | 13.2 /100 | #225 | Poor $45,090 |
| Immigrants | Nigeria | 12.2 /100 | #226 | Poor $45,030 |
| Native Hawaiians | 12.2 /100 | #227 | Poor $45,027 |
Demographics Similar to Immigrants from Dominican Republic by Median Earnings
In terms of median earnings, the demographic groups most similar to Immigrants from Dominican Republic are Comanche ($41,519, a difference of 0.080%), Paiute ($41,508, a difference of 0.11%), Central American Indian ($41,474, a difference of 0.19%), U.S. Virgin Islander ($41,448, a difference of 0.26%), and Indonesian ($41,701, a difference of 0.35%).
| Demographics | Rating | Rank | Median Earnings |
| Marshallese | 0.2 /100 | #281 | Tragic $41,969 |
| Africans | 0.2 /100 | #282 | Tragic $41,955 |
| Dominicans | 0.2 /100 | #283 | Tragic $41,864 |
| Blackfeet | 0.2 /100 | #284 | Tragic $41,822 |
| Immigrants | Nicaragua | 0.1 /100 | #285 | Tragic $41,737 |
| Mexican American Indians | 0.1 /100 | #286 | Tragic $41,719 |
| Indonesians | 0.1 /100 | #287 | Tragic $41,701 |
| Immigrants | Dominican Republic | 0.1 /100 | #288 | Tragic $41,554 |
| Comanche | 0.1 /100 | #289 | Tragic $41,519 |
| Paiute | 0.1 /100 | #290 | Tragic $41,508 |
| Central American Indians | 0.1 /100 | #291 | Tragic $41,474 |
| U.S. Virgin Islanders | 0.1 /100 | #292 | Tragic $41,448 |
| Immigrants | Zaire | 0.1 /100 | #293 | Tragic $41,325 |
| Potawatomi | 0.1 /100 | #294 | Tragic $41,288 |
| Bangladeshis | 0.1 /100 | #295 | Tragic $41,263 |