Ecuadorian vs Immigrants from Czechoslovakia Median Earnings
COMPARE
Ecuadorian
Immigrants from Czechoslovakia
Median Earnings
Median Earnings Comparison
Ecuadorians
Immigrants from Czechoslovakia
$45,214
MEDIAN EARNINGS
15.3/ 100
METRIC RATING
220th/ 347
METRIC RANK
$52,361
MEDIAN EARNINGS
100.0/ 100
METRIC RATING
45th/ 347
METRIC RANK
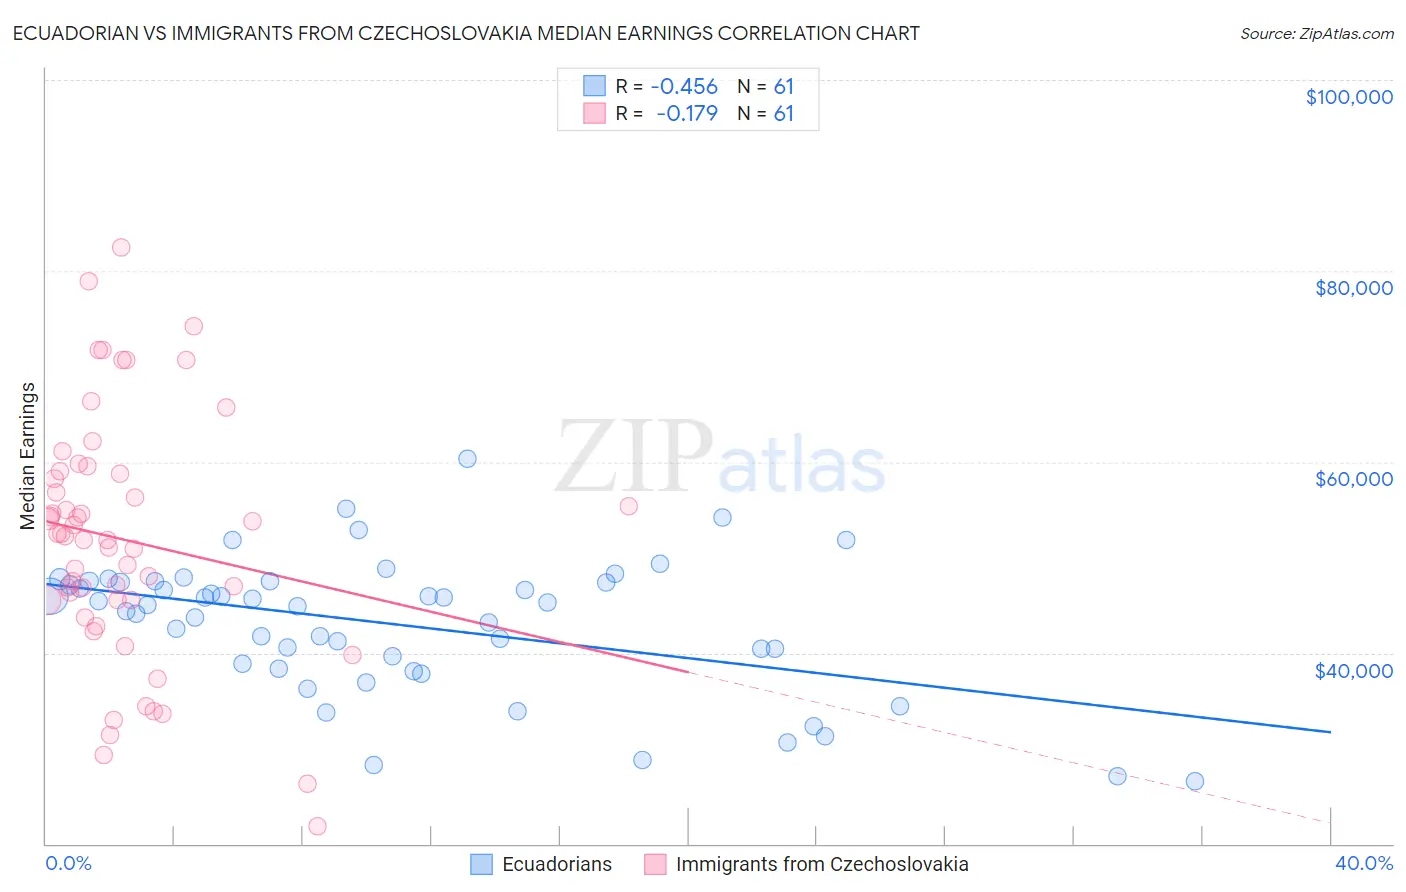
Ecuadorian vs Immigrants from Czechoslovakia Median Earnings Correlation Chart
The statistical analysis conducted on geographies consisting of 317,848,977 people shows a moderate negative correlation between the proportion of Ecuadorians and median earnings in the United States with a correlation coefficient (R) of -0.456 and weighted average of $45,214. Similarly, the statistical analysis conducted on geographies consisting of 195,449,585 people shows a poor negative correlation between the proportion of Immigrants from Czechoslovakia and median earnings in the United States with a correlation coefficient (R) of -0.179 and weighted average of $52,361, a difference of 15.8%.
Median Earnings Correlation Summary
| Measurement | Ecuadorian | Immigrants from Czechoslovakia |
| Minimum | $26,500 | $21,875 |
| Maximum | $60,377 | $82,450 |
| Range | $33,877 | $60,575 |
| Mean | $42,954 | $51,817 |
| Median | $45,047 | $52,166 |
| Interquartile 25% (IQ1) | $38,574 | $45,495 |
| Interquartile 75% (IQ3) | $47,434 | $58,910 |
| Interquartile Range (IQR) | $8,860 | $13,415 |
| Standard Deviation (Sample) | $7,114 | $12,779 |
| Standard Deviation (Population) | $7,055 | $12,674 |
Similar Demographics by Median Earnings
Demographics Similar to Ecuadorians by Median Earnings
In terms of median earnings, the demographic groups most similar to Ecuadorians are Immigrants from Guyana ($45,204, a difference of 0.020%), Immigrants from Panama ($45,198, a difference of 0.030%), White/Caucasian ($45,197, a difference of 0.040%), West Indian ($45,132, a difference of 0.18%), and Immigrants from Cambodia ($45,090, a difference of 0.28%).
| Demographics | Rating | Rank | Median Earnings |
| Immigrants | Colombia | 22.4 /100 | #213 | Fair $45,550 |
| Nigerians | 22.0 /100 | #214 | Fair $45,532 |
| Immigrants | Bangladesh | 22.0 /100 | #215 | Fair $45,532 |
| Guyanese | 20.6 /100 | #216 | Fair $45,470 |
| Tlingit-Haida | 20.5 /100 | #217 | Fair $45,468 |
| Spanish | 19.7 /100 | #218 | Poor $45,432 |
| Dutch | 18.4 /100 | #219 | Poor $45,370 |
| Ecuadorians | 15.3 /100 | #220 | Poor $45,214 |
| Immigrants | Guyana | 15.1 /100 | #221 | Poor $45,204 |
| Immigrants | Panama | 15.0 /100 | #222 | Poor $45,198 |
| Whites/Caucasians | 15.0 /100 | #223 | Poor $45,197 |
| West Indians | 13.9 /100 | #224 | Poor $45,132 |
| Immigrants | Cambodia | 13.2 /100 | #225 | Poor $45,090 |
| Immigrants | Nigeria | 12.2 /100 | #226 | Poor $45,030 |
| Native Hawaiians | 12.2 /100 | #227 | Poor $45,027 |
Demographics Similar to Immigrants from Czechoslovakia by Median Earnings
In terms of median earnings, the demographic groups most similar to Immigrants from Czechoslovakia are Bhutanese ($52,297, a difference of 0.12%), Australian ($52,294, a difference of 0.13%), Immigrants from Malaysia ($52,514, a difference of 0.29%), Bulgarian ($52,512, a difference of 0.29%), and Maltese ($52,526, a difference of 0.31%).
| Demographics | Rating | Rank | Median Earnings |
| Latvians | 100.0 /100 | #38 | Exceptional $53,001 |
| Immigrants | Turkey | 100.0 /100 | #39 | Exceptional $52,960 |
| Israelis | 100.0 /100 | #40 | Exceptional $52,937 |
| Immigrants | Lithuania | 100.0 /100 | #41 | Exceptional $52,769 |
| Maltese | 100.0 /100 | #42 | Exceptional $52,526 |
| Immigrants | Malaysia | 100.0 /100 | #43 | Exceptional $52,514 |
| Bulgarians | 100.0 /100 | #44 | Exceptional $52,512 |
| Immigrants | Czechoslovakia | 100.0 /100 | #45 | Exceptional $52,361 |
| Bhutanese | 100.0 /100 | #46 | Exceptional $52,297 |
| Australians | 100.0 /100 | #47 | Exceptional $52,294 |
| Immigrants | Europe | 100.0 /100 | #48 | Exceptional $52,195 |
| Bolivians | 100.0 /100 | #49 | Exceptional $52,005 |
| Immigrants | South Africa | 100.0 /100 | #50 | Exceptional $51,850 |
| Immigrants | Austria | 99.9 /100 | #51 | Exceptional $51,826 |
| Estonians | 99.9 /100 | #52 | Exceptional $51,772 |