Ecuadorian vs Immigrants from India Median Earnings
COMPARE
Ecuadorian
Immigrants from India
Median Earnings
Median Earnings Comparison
Ecuadorians
Immigrants from India
$45,214
MEDIAN EARNINGS
15.3/ 100
METRIC RATING
220th/ 347
METRIC RANK
$60,648
MEDIAN EARNINGS
100.0/ 100
METRIC RATING
3rd/ 347
METRIC RANK
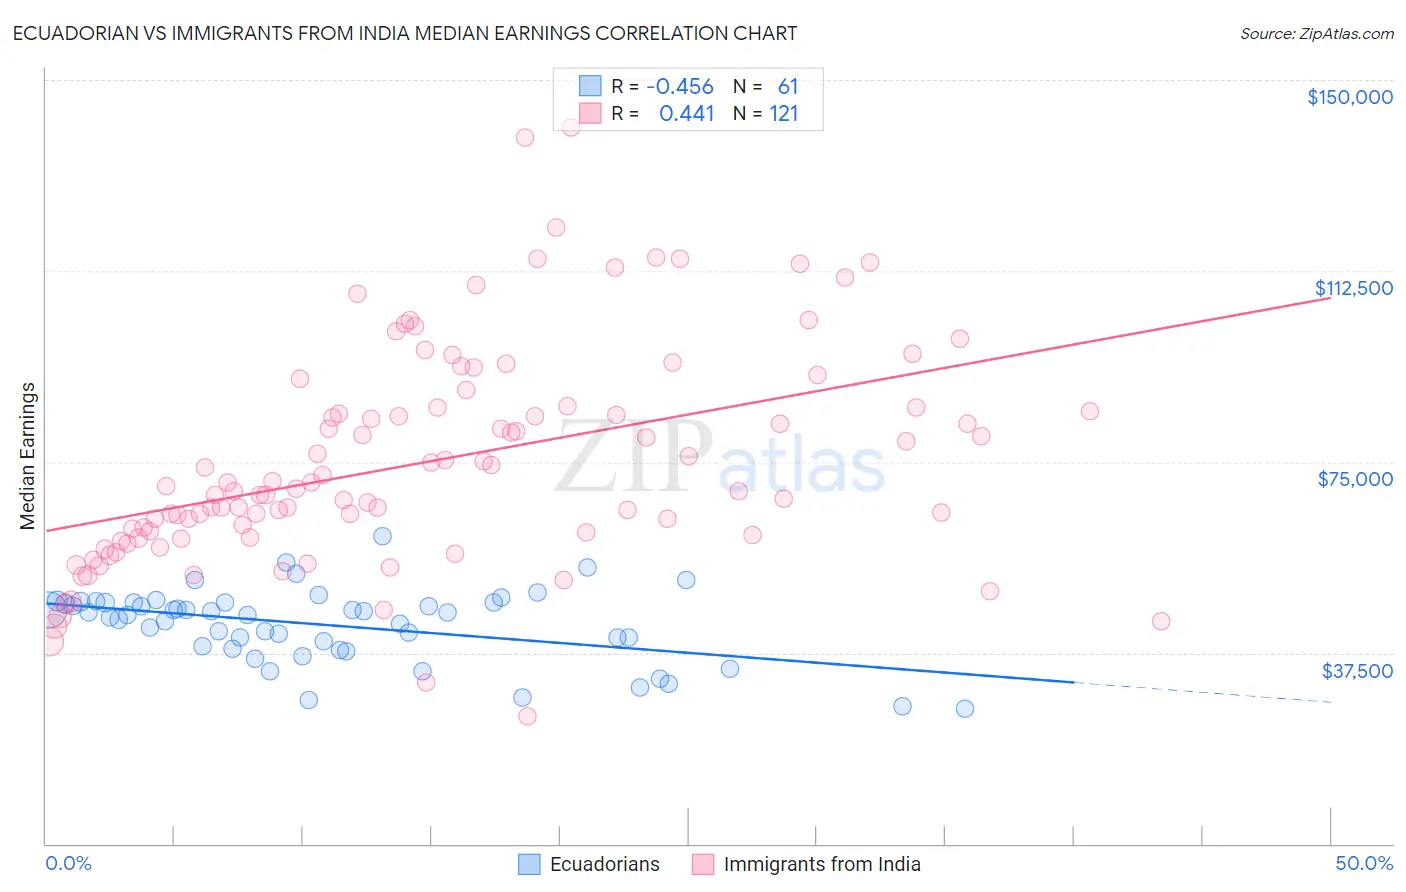
Ecuadorian vs Immigrants from India Median Earnings Correlation Chart
The statistical analysis conducted on geographies consisting of 317,848,977 people shows a moderate negative correlation between the proportion of Ecuadorians and median earnings in the United States with a correlation coefficient (R) of -0.456 and weighted average of $45,214. Similarly, the statistical analysis conducted on geographies consisting of 434,105,381 people shows a moderate positive correlation between the proportion of Immigrants from India and median earnings in the United States with a correlation coefficient (R) of 0.441 and weighted average of $60,648, a difference of 34.1%.
Median Earnings Correlation Summary
| Measurement | Ecuadorian | Immigrants from India |
| Minimum | $26,500 | $24,957 |
| Maximum | $60,377 | $140,742 |
| Range | $33,877 | $115,785 |
| Mean | $42,954 | $74,941 |
| Median | $45,047 | $69,769 |
| Interquartile 25% (IQ1) | $38,574 | $60,363 |
| Interquartile 75% (IQ3) | $47,434 | $85,753 |
| Interquartile Range (IQR) | $8,860 | $25,390 |
| Standard Deviation (Sample) | $7,114 | $21,309 |
| Standard Deviation (Population) | $7,055 | $21,220 |
Similar Demographics by Median Earnings
Demographics Similar to Ecuadorians by Median Earnings
In terms of median earnings, the demographic groups most similar to Ecuadorians are Immigrants from Guyana ($45,204, a difference of 0.020%), Immigrants from Panama ($45,198, a difference of 0.030%), White/Caucasian ($45,197, a difference of 0.040%), West Indian ($45,132, a difference of 0.18%), and Immigrants from Cambodia ($45,090, a difference of 0.28%).
| Demographics | Rating | Rank | Median Earnings |
| Immigrants | Colombia | 22.4 /100 | #213 | Fair $45,550 |
| Nigerians | 22.0 /100 | #214 | Fair $45,532 |
| Immigrants | Bangladesh | 22.0 /100 | #215 | Fair $45,532 |
| Guyanese | 20.6 /100 | #216 | Fair $45,470 |
| Tlingit-Haida | 20.5 /100 | #217 | Fair $45,468 |
| Spanish | 19.7 /100 | #218 | Poor $45,432 |
| Dutch | 18.4 /100 | #219 | Poor $45,370 |
| Ecuadorians | 15.3 /100 | #220 | Poor $45,214 |
| Immigrants | Guyana | 15.1 /100 | #221 | Poor $45,204 |
| Immigrants | Panama | 15.0 /100 | #222 | Poor $45,198 |
| Whites/Caucasians | 15.0 /100 | #223 | Poor $45,197 |
| West Indians | 13.9 /100 | #224 | Poor $45,132 |
| Immigrants | Cambodia | 13.2 /100 | #225 | Poor $45,090 |
| Immigrants | Nigeria | 12.2 /100 | #226 | Poor $45,030 |
| Native Hawaiians | 12.2 /100 | #227 | Poor $45,027 |
Demographics Similar to Immigrants from India by Median Earnings
In terms of median earnings, the demographic groups most similar to Immigrants from India are Immigrants from Taiwan ($61,151, a difference of 0.83%), Filipino ($61,197, a difference of 0.91%), Immigrants from Hong Kong ($59,433, a difference of 2.0%), Thai ($59,237, a difference of 2.4%), and Immigrants from Singapore ($59,038, a difference of 2.7%).
| Demographics | Rating | Rank | Median Earnings |
| Filipinos | 100.0 /100 | #1 | Exceptional $61,197 |
| Immigrants | Taiwan | 100.0 /100 | #2 | Exceptional $61,151 |
| Immigrants | India | 100.0 /100 | #3 | Exceptional $60,648 |
| Immigrants | Hong Kong | 100.0 /100 | #4 | Exceptional $59,433 |
| Thais | 100.0 /100 | #5 | Exceptional $59,237 |
| Immigrants | Singapore | 100.0 /100 | #6 | Exceptional $59,038 |
| Iranians | 100.0 /100 | #7 | Exceptional $58,474 |
| Immigrants | Iran | 100.0 /100 | #8 | Exceptional $57,612 |
| Okinawans | 100.0 /100 | #9 | Exceptional $57,550 |
| Immigrants | South Central Asia | 100.0 /100 | #10 | Exceptional $57,114 |
| Immigrants | Israel | 100.0 /100 | #11 | Exceptional $57,034 |
| Immigrants | Ireland | 100.0 /100 | #12 | Exceptional $56,854 |
| Immigrants | China | 100.0 /100 | #13 | Exceptional $56,638 |
| Immigrants | Australia | 100.0 /100 | #14 | Exceptional $56,305 |
| Indians (Asian) | 100.0 /100 | #15 | Exceptional $56,253 |