Ecuadorian vs Immigrants from Trinidad and Tobago Doctorate Degree
COMPARE
Ecuadorian
Immigrants from Trinidad and Tobago
Doctorate Degree
Doctorate Degree Comparison
Ecuadorians
Immigrants from Trinidad and Tobago
1.5%
DOCTORATE DEGREE
0.4/ 100
METRIC RATING
280th/ 347
METRIC RANK
1.5%
DOCTORATE DEGREE
0.5/ 100
METRIC RATING
271st/ 347
METRIC RANK
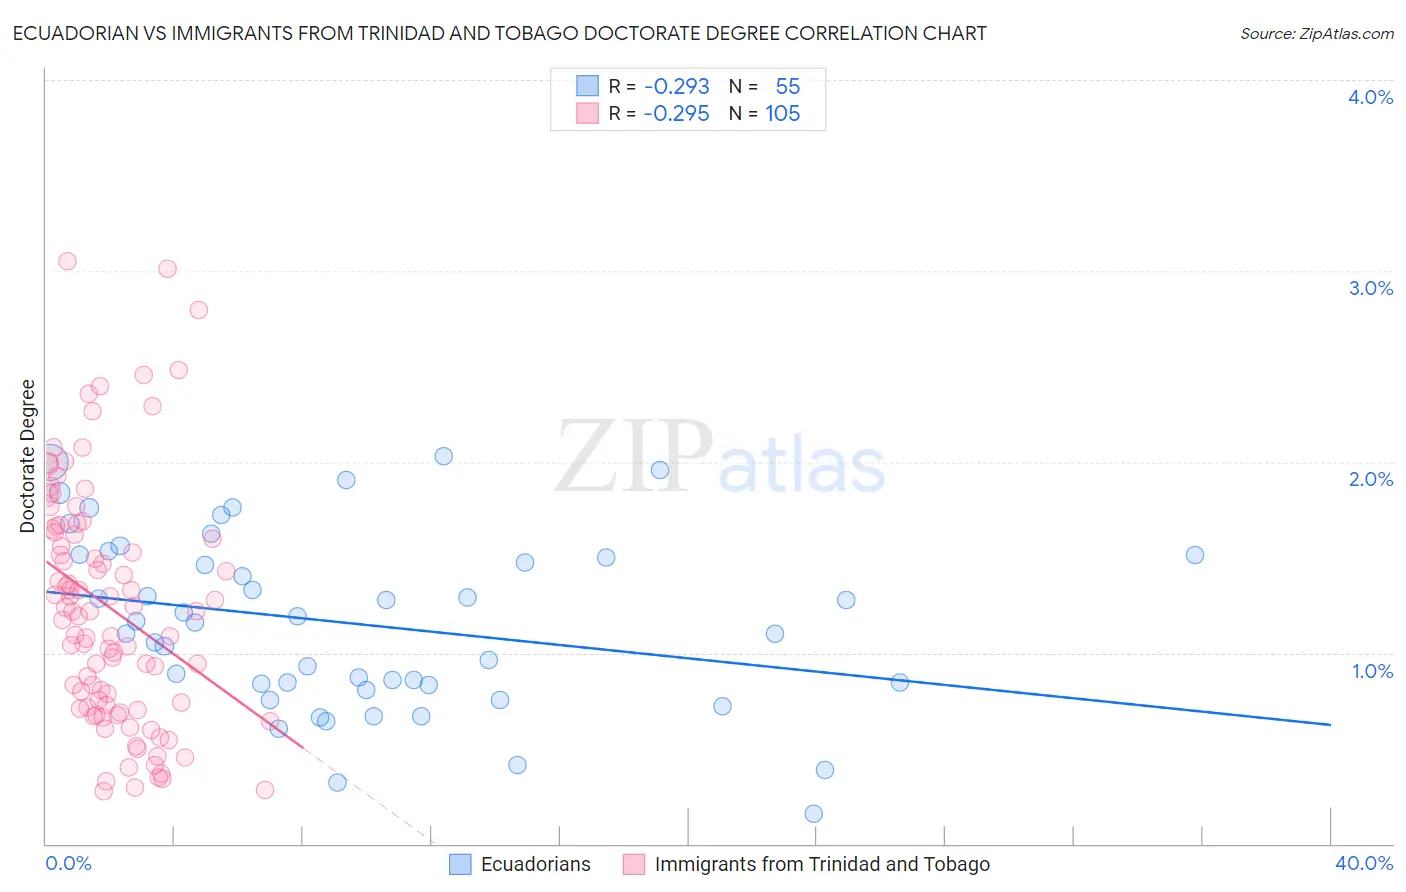
Ecuadorian vs Immigrants from Trinidad and Tobago Doctorate Degree Correlation Chart
The statistical analysis conducted on geographies consisting of 316,205,329 people shows a weak negative correlation between the proportion of Ecuadorians and percentage of population with at least doctorate degree education in the United States with a correlation coefficient (R) of -0.293 and weighted average of 1.5%. Similarly, the statistical analysis conducted on geographies consisting of 222,674,417 people shows a weak negative correlation between the proportion of Immigrants from Trinidad and Tobago and percentage of population with at least doctorate degree education in the United States with a correlation coefficient (R) of -0.295 and weighted average of 1.5%, a difference of 1.2%.
Doctorate Degree Correlation Summary
| Measurement | Ecuadorian | Immigrants from Trinidad and Tobago |
| Minimum | 0.16% | 0.28% |
| Maximum | 2.0% | 3.0% |
| Range | 1.9% | 2.8% |
| Mean | 1.1% | 1.2% |
| Median | 1.2% | 1.2% |
| Interquartile 25% (IQ1) | 0.83% | 0.71% |
| Interquartile 75% (IQ3) | 1.5% | 1.6% |
| Interquartile Range (IQR) | 0.68% | 0.93% |
| Standard Deviation (Sample) | 0.46% | 0.63% |
| Standard Deviation (Population) | 0.45% | 0.63% |
Demographics Similar to Ecuadorians and Immigrants from Trinidad and Tobago by Doctorate Degree
In terms of doctorate degree, the demographic groups most similar to Ecuadorians are Marshallese (1.5%, a difference of 0.010%), Tohono O'odham (1.5%, a difference of 0.060%), British West Indian (1.5%, a difference of 0.12%), Central American (1.5%, a difference of 0.16%), and Jamaican (1.5%, a difference of 0.20%). Similarly, the demographic groups most similar to Immigrants from Trinidad and Tobago are Salvadoran (1.5%, a difference of 0.070%), Immigrants from Barbados (1.5%, a difference of 0.090%), Crow (1.5%, a difference of 0.10%), Kiowa (1.5%, a difference of 0.19%), and U.S. Virgin Islander (1.5%, a difference of 0.19%).
| Demographics | Rating | Rank | Doctorate Degree |
| Nicaraguans | 0.6 /100 | #265 | Tragic 1.5% |
| Immigrants | Liberia | 0.5 /100 | #266 | Tragic 1.5% |
| Kiowa | 0.5 /100 | #267 | Tragic 1.5% |
| U.S. Virgin Islanders | 0.5 /100 | #268 | Tragic 1.5% |
| Crow | 0.5 /100 | #269 | Tragic 1.5% |
| Salvadorans | 0.5 /100 | #270 | Tragic 1.5% |
| Immigrants | Trinidad and Tobago | 0.5 /100 | #271 | Tragic 1.5% |
| Immigrants | Barbados | 0.4 /100 | #272 | Tragic 1.5% |
| Sioux | 0.4 /100 | #273 | Tragic 1.5% |
| Yaqui | 0.4 /100 | #274 | Tragic 1.5% |
| Aleuts | 0.4 /100 | #275 | Tragic 1.5% |
| Paiute | 0.4 /100 | #276 | Tragic 1.5% |
| Bahamians | 0.4 /100 | #277 | Tragic 1.5% |
| Hawaiians | 0.4 /100 | #278 | Tragic 1.5% |
| Marshallese | 0.4 /100 | #279 | Tragic 1.5% |
| Ecuadorians | 0.4 /100 | #280 | Tragic 1.5% |
| Tohono O'odham | 0.4 /100 | #281 | Tragic 1.5% |
| British West Indians | 0.3 /100 | #282 | Tragic 1.5% |
| Central Americans | 0.3 /100 | #283 | Tragic 1.5% |
| Jamaicans | 0.3 /100 | #284 | Tragic 1.5% |
| Malaysians | 0.3 /100 | #285 | Tragic 1.5% |