Ecuadorian vs Immigrants from Iraq Unemployment Among Youth under 25 years
COMPARE
Ecuadorian
Immigrants from Iraq
Unemployment Among Youth under 25 years
Unemployment Among Youth under 25 years Comparison
Ecuadorians
Immigrants from Iraq
13.3%
UNEMPLOYMENT AMONG YOUTH UNDER 25 YEARS
0.0/ 100
METRIC RATING
287th/ 347
METRIC RANK
11.6%
UNEMPLOYMENT AMONG YOUTH UNDER 25 YEARS
47.0/ 100
METRIC RATING
175th/ 347
METRIC RANK
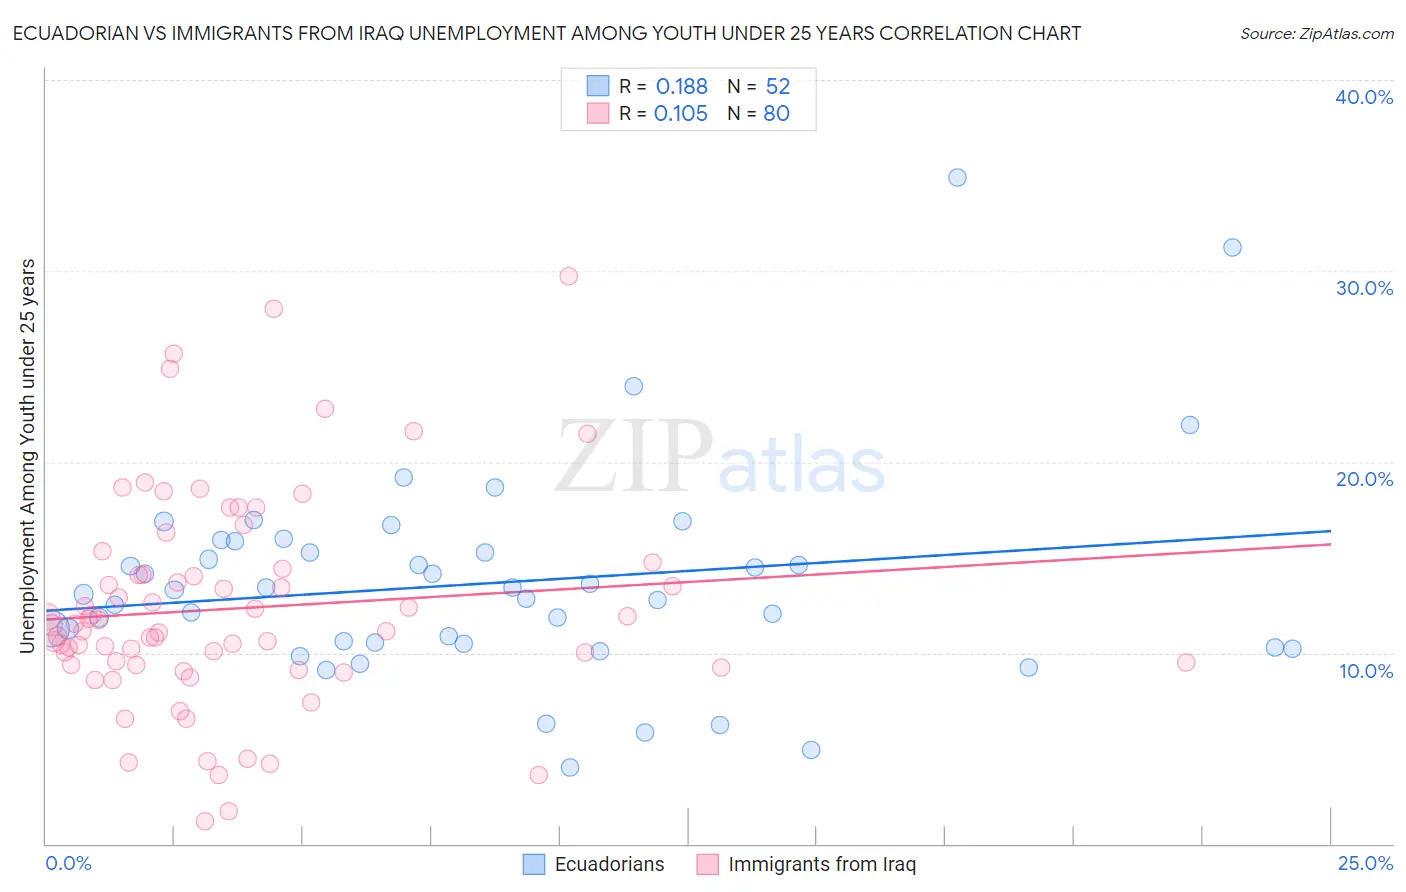
Ecuadorian vs Immigrants from Iraq Unemployment Among Youth under 25 years Correlation Chart
The statistical analysis conducted on geographies consisting of 315,619,681 people shows a poor positive correlation between the proportion of Ecuadorians and unemployment rate among youth under the age of 25 in the United States with a correlation coefficient (R) of 0.188 and weighted average of 13.3%. Similarly, the statistical analysis conducted on geographies consisting of 194,003,673 people shows a poor positive correlation between the proportion of Immigrants from Iraq and unemployment rate among youth under the age of 25 in the United States with a correlation coefficient (R) of 0.105 and weighted average of 11.6%, a difference of 14.5%.
Unemployment Among Youth under 25 years Correlation Summary
| Measurement | Ecuadorian | Immigrants from Iraq |
| Minimum | 4.0% | 1.2% |
| Maximum | 34.9% | 29.7% |
| Range | 30.9% | 28.5% |
| Mean | 13.7% | 12.3% |
| Median | 13.2% | 11.3% |
| Interquartile 25% (IQ1) | 10.5% | 9.4% |
| Interquartile 75% (IQ3) | 15.6% | 14.2% |
| Interquartile Range (IQR) | 5.0% | 4.9% |
| Standard Deviation (Sample) | 5.5% | 5.6% |
| Standard Deviation (Population) | 5.5% | 5.5% |
Similar Demographics by Unemployment Among Youth under 25 years
Demographics Similar to Ecuadorians by Unemployment Among Youth under 25 years
In terms of unemployment among youth under 25 years, the demographic groups most similar to Ecuadorians are Blackfeet (13.3%, a difference of 0.010%), Ghanaian (13.3%, a difference of 0.060%), Lumbee (13.3%, a difference of 0.14%), Immigrants from Cameroon (13.3%, a difference of 0.16%), and Sierra Leonean (13.3%, a difference of 0.18%).
| Demographics | Rating | Rank | Unemployment Among Youth under 25 years |
| Ute | 0.0 /100 | #280 | Tragic 13.3% |
| Armenians | 0.0 /100 | #281 | Tragic 13.3% |
| Sierra Leoneans | 0.0 /100 | #282 | Tragic 13.3% |
| Immigrants | Cameroon | 0.0 /100 | #283 | Tragic 13.3% |
| Lumbee | 0.0 /100 | #284 | Tragic 13.3% |
| Ghanaians | 0.0 /100 | #285 | Tragic 13.3% |
| Blackfeet | 0.0 /100 | #286 | Tragic 13.3% |
| Ecuadorians | 0.0 /100 | #287 | Tragic 13.3% |
| Immigrants | Western Africa | 0.0 /100 | #288 | Tragic 13.4% |
| Immigrants | Ghana | 0.0 /100 | #289 | Tragic 13.4% |
| Immigrants | Ecuador | 0.0 /100 | #290 | Tragic 13.4% |
| Apache | 0.0 /100 | #291 | Tragic 13.5% |
| Central American Indians | 0.0 /100 | #292 | Tragic 13.5% |
| Spanish American Indians | 0.0 /100 | #293 | Tragic 13.5% |
| Immigrants | Caribbean | 0.0 /100 | #294 | Tragic 13.5% |
Demographics Similar to Immigrants from Iraq by Unemployment Among Youth under 25 years
In terms of unemployment among youth under 25 years, the demographic groups most similar to Immigrants from Iraq are Ugandan (11.6%, a difference of 0.060%), Immigrants from Denmark (11.6%, a difference of 0.090%), Immigrants from China (11.6%, a difference of 0.12%), Immigrants from South Eastern Asia (11.6%, a difference of 0.19%), and Immigrants from Europe (11.6%, a difference of 0.19%).
| Demographics | Rating | Rank | Unemployment Among Youth under 25 years |
| Potawatomi | 57.9 /100 | #168 | Average 11.6% |
| Eastern Europeans | 57.5 /100 | #169 | Average 11.6% |
| Russians | 57.3 /100 | #170 | Average 11.6% |
| Bangladeshis | 55.6 /100 | #171 | Average 11.6% |
| Immigrants | Morocco | 55.1 /100 | #172 | Average 11.6% |
| Immigrants | South Eastern Asia | 51.7 /100 | #173 | Average 11.6% |
| Immigrants | China | 50.0 /100 | #174 | Average 11.6% |
| Immigrants | Iraq | 47.0 /100 | #175 | Average 11.6% |
| Ugandans | 45.6 /100 | #176 | Average 11.6% |
| Immigrants | Denmark | 45.0 /100 | #177 | Average 11.6% |
| Immigrants | Europe | 42.4 /100 | #178 | Average 11.6% |
| Immigrants | Hong Kong | 42.4 /100 | #179 | Average 11.6% |
| Spaniards | 39.8 /100 | #180 | Fair 11.7% |
| Syrians | 38.4 /100 | #181 | Fair 11.7% |
| Immigrants | Italy | 36.2 /100 | #182 | Fair 11.7% |