Dutch West Indian vs Immigrants from Hong Kong Median Earnings
COMPARE
Dutch West Indian
Immigrants from Hong Kong
Median Earnings
Median Earnings Comparison
Dutch West Indians
Immigrants from Hong Kong
$40,107
MEDIAN EARNINGS
0.0/ 100
METRIC RATING
318th/ 347
METRIC RANK
$59,433
MEDIAN EARNINGS
100.0/ 100
METRIC RATING
4th/ 347
METRIC RANK
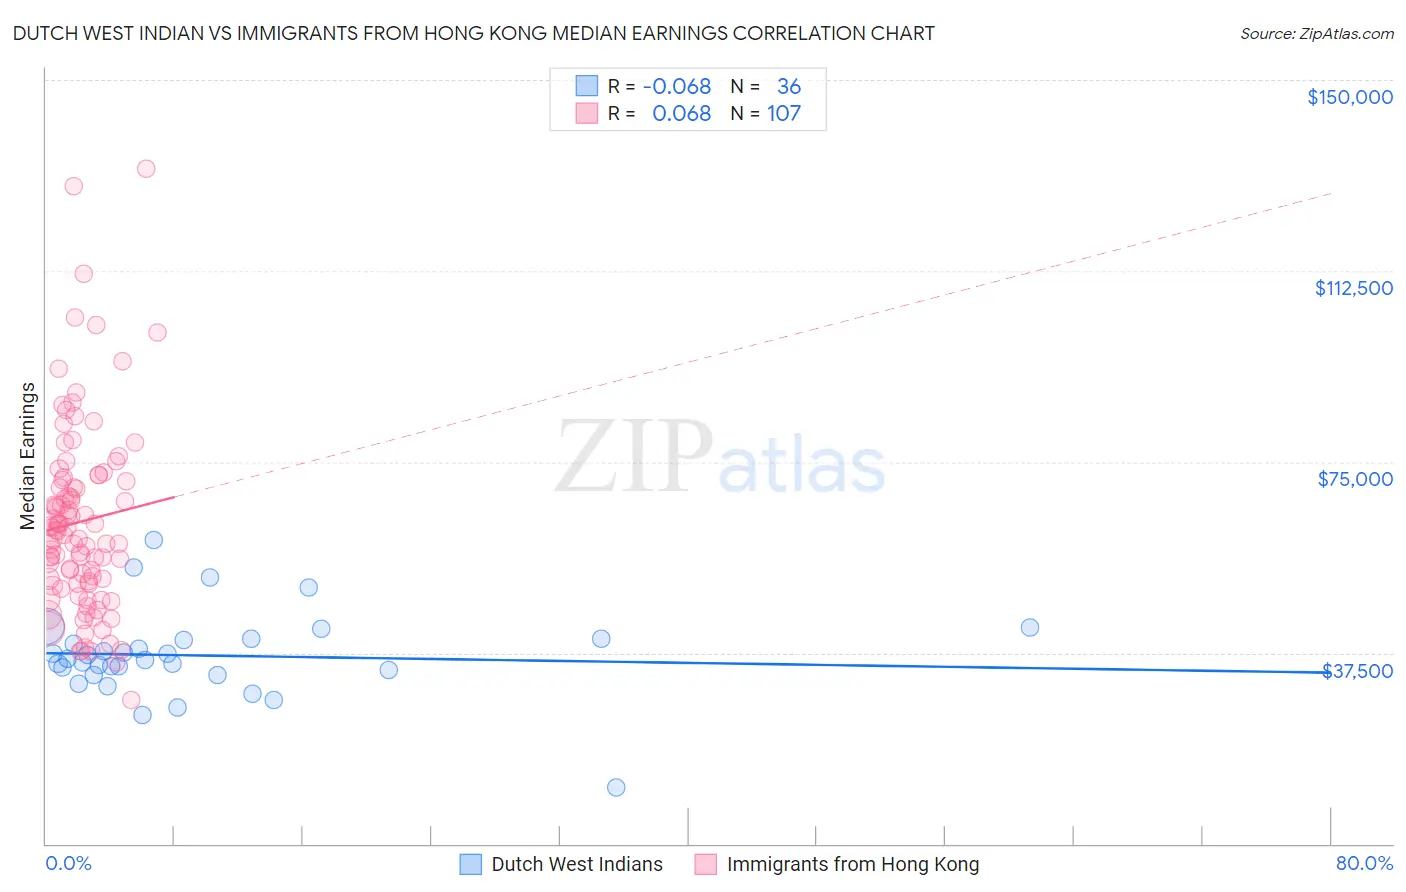
Dutch West Indian vs Immigrants from Hong Kong Median Earnings Correlation Chart
The statistical analysis conducted on geographies consisting of 85,770,657 people shows a slight negative correlation between the proportion of Dutch West Indians and median earnings in the United States with a correlation coefficient (R) of -0.068 and weighted average of $40,107. Similarly, the statistical analysis conducted on geographies consisting of 253,960,155 people shows a slight positive correlation between the proportion of Immigrants from Hong Kong and median earnings in the United States with a correlation coefficient (R) of 0.068 and weighted average of $59,433, a difference of 48.2%.
Median Earnings Correlation Summary
| Measurement | Dutch West Indian | Immigrants from Hong Kong |
| Minimum | $11,071 | $28,125 |
| Maximum | $59,688 | $132,614 |
| Range | $48,617 | $104,489 |
| Mean | $36,968 | $63,267 |
| Median | $36,241 | $61,404 |
| Interquartile 25% (IQ1) | $33,646 | $51,159 |
| Interquartile 75% (IQ3) | $40,145 | $71,509 |
| Interquartile Range (IQR) | $6,499 | $20,350 |
| Standard Deviation (Sample) | $8,507 | $18,453 |
| Standard Deviation (Population) | $8,388 | $18,367 |
Similar Demographics by Median Earnings
Demographics Similar to Dutch West Indians by Median Earnings
In terms of median earnings, the demographic groups most similar to Dutch West Indians are Black/African American ($40,085, a difference of 0.060%), Fijian ($40,193, a difference of 0.21%), Immigrants from Honduras ($40,195, a difference of 0.22%), Cheyenne ($40,233, a difference of 0.31%), and Seminole ($40,233, a difference of 0.31%).
| Demographics | Rating | Rank | Median Earnings |
| Hispanics or Latinos | 0.0 /100 | #311 | Tragic $40,288 |
| Chippewa | 0.0 /100 | #312 | Tragic $40,287 |
| Choctaw | 0.0 /100 | #313 | Tragic $40,270 |
| Cheyenne | 0.0 /100 | #314 | Tragic $40,233 |
| Seminole | 0.0 /100 | #315 | Tragic $40,233 |
| Immigrants | Honduras | 0.0 /100 | #316 | Tragic $40,195 |
| Fijians | 0.0 /100 | #317 | Tragic $40,193 |
| Dutch West Indians | 0.0 /100 | #318 | Tragic $40,107 |
| Blacks/African Americans | 0.0 /100 | #319 | Tragic $40,085 |
| Immigrants | Bahamas | 0.0 /100 | #320 | Tragic $39,861 |
| Mexicans | 0.0 /100 | #321 | Tragic $39,834 |
| Immigrants | Central America | 0.0 /100 | #322 | Tragic $39,762 |
| Bahamians | 0.0 /100 | #323 | Tragic $39,735 |
| Ottawa | 0.0 /100 | #324 | Tragic $39,721 |
| Creek | 0.0 /100 | #325 | Tragic $39,648 |
Demographics Similar to Immigrants from Hong Kong by Median Earnings
In terms of median earnings, the demographic groups most similar to Immigrants from Hong Kong are Thai ($59,237, a difference of 0.33%), Immigrants from Singapore ($59,038, a difference of 0.67%), Iranian ($58,474, a difference of 1.6%), Immigrants from India ($60,648, a difference of 2.0%), and Immigrants from Taiwan ($61,151, a difference of 2.9%).
| Demographics | Rating | Rank | Median Earnings |
| Filipinos | 100.0 /100 | #1 | Exceptional $61,197 |
| Immigrants | Taiwan | 100.0 /100 | #2 | Exceptional $61,151 |
| Immigrants | India | 100.0 /100 | #3 | Exceptional $60,648 |
| Immigrants | Hong Kong | 100.0 /100 | #4 | Exceptional $59,433 |
| Thais | 100.0 /100 | #5 | Exceptional $59,237 |
| Immigrants | Singapore | 100.0 /100 | #6 | Exceptional $59,038 |
| Iranians | 100.0 /100 | #7 | Exceptional $58,474 |
| Immigrants | Iran | 100.0 /100 | #8 | Exceptional $57,612 |
| Okinawans | 100.0 /100 | #9 | Exceptional $57,550 |
| Immigrants | South Central Asia | 100.0 /100 | #10 | Exceptional $57,114 |
| Immigrants | Israel | 100.0 /100 | #11 | Exceptional $57,034 |
| Immigrants | Ireland | 100.0 /100 | #12 | Exceptional $56,854 |
| Immigrants | China | 100.0 /100 | #13 | Exceptional $56,638 |
| Immigrants | Australia | 100.0 /100 | #14 | Exceptional $56,305 |
| Indians (Asian) | 100.0 /100 | #15 | Exceptional $56,253 |