Dutch West Indian vs Alaskan Athabascan Median Earnings
COMPARE
Dutch West Indian
Alaskan Athabascan
Median Earnings
Median Earnings Comparison
Dutch West Indians
Alaskan Athabascans
$40,107
MEDIAN EARNINGS
0.0/ 100
METRIC RATING
318th/ 347
METRIC RANK
$43,393
MEDIAN EARNINGS
1.4/ 100
METRIC RATING
256th/ 347
METRIC RANK
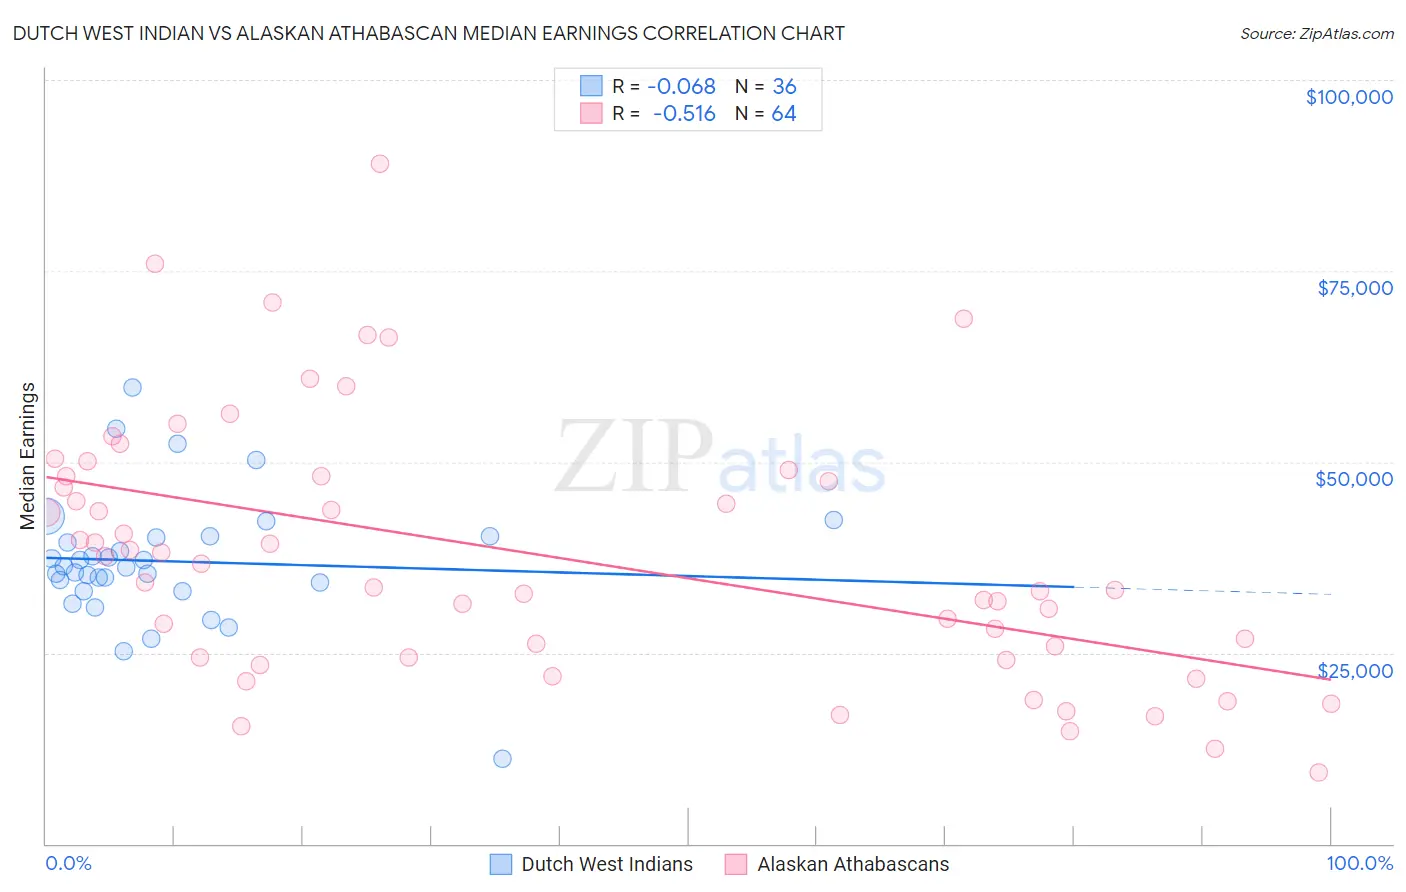
Dutch West Indian vs Alaskan Athabascan Median Earnings Correlation Chart
The statistical analysis conducted on geographies consisting of 85,770,657 people shows a slight negative correlation between the proportion of Dutch West Indians and median earnings in the United States with a correlation coefficient (R) of -0.068 and weighted average of $40,107. Similarly, the statistical analysis conducted on geographies consisting of 45,815,417 people shows a substantial negative correlation between the proportion of Alaskan Athabascans and median earnings in the United States with a correlation coefficient (R) of -0.516 and weighted average of $43,393, a difference of 8.2%.
Median Earnings Correlation Summary
| Measurement | Dutch West Indian | Alaskan Athabascan |
| Minimum | $11,071 | $9,375 |
| Maximum | $59,688 | $89,063 |
| Range | $48,617 | $79,688 |
| Mean | $36,968 | $37,849 |
| Median | $36,241 | $35,412 |
| Interquartile 25% (IQ1) | $33,646 | $24,340 |
| Interquartile 75% (IQ3) | $40,145 | $48,159 |
| Interquartile Range (IQR) | $6,499 | $23,819 |
| Standard Deviation (Sample) | $8,507 | $17,033 |
| Standard Deviation (Population) | $8,388 | $16,899 |
Similar Demographics by Median Earnings
Demographics Similar to Dutch West Indians by Median Earnings
In terms of median earnings, the demographic groups most similar to Dutch West Indians are Black/African American ($40,085, a difference of 0.060%), Fijian ($40,193, a difference of 0.21%), Immigrants from Honduras ($40,195, a difference of 0.22%), Cheyenne ($40,233, a difference of 0.31%), and Seminole ($40,233, a difference of 0.31%).
| Demographics | Rating | Rank | Median Earnings |
| Hispanics or Latinos | 0.0 /100 | #311 | Tragic $40,288 |
| Chippewa | 0.0 /100 | #312 | Tragic $40,287 |
| Choctaw | 0.0 /100 | #313 | Tragic $40,270 |
| Cheyenne | 0.0 /100 | #314 | Tragic $40,233 |
| Seminole | 0.0 /100 | #315 | Tragic $40,233 |
| Immigrants | Honduras | 0.0 /100 | #316 | Tragic $40,195 |
| Fijians | 0.0 /100 | #317 | Tragic $40,193 |
| Dutch West Indians | 0.0 /100 | #318 | Tragic $40,107 |
| Blacks/African Americans | 0.0 /100 | #319 | Tragic $40,085 |
| Immigrants | Bahamas | 0.0 /100 | #320 | Tragic $39,861 |
| Mexicans | 0.0 /100 | #321 | Tragic $39,834 |
| Immigrants | Central America | 0.0 /100 | #322 | Tragic $39,762 |
| Bahamians | 0.0 /100 | #323 | Tragic $39,735 |
| Ottawa | 0.0 /100 | #324 | Tragic $39,721 |
| Creek | 0.0 /100 | #325 | Tragic $39,648 |
Demographics Similar to Alaskan Athabascans by Median Earnings
In terms of median earnings, the demographic groups most similar to Alaskan Athabascans are Immigrants from Middle Africa ($43,416, a difference of 0.050%), Jamaican ($43,343, a difference of 0.12%), French American Indian ($43,333, a difference of 0.14%), Liberian ($43,536, a difference of 0.33%), and Somali ($43,567, a difference of 0.40%).
| Demographics | Rating | Rank | Median Earnings |
| Malaysians | 2.6 /100 | #249 | Tragic $43,844 |
| Alaska Natives | 2.3 /100 | #250 | Tragic $43,750 |
| Tsimshian | 2.1 /100 | #251 | Tragic $43,695 |
| Hawaiians | 2.0 /100 | #252 | Tragic $43,673 |
| Somalis | 1.8 /100 | #253 | Tragic $43,567 |
| Liberians | 1.7 /100 | #254 | Tragic $43,536 |
| Immigrants | Middle Africa | 1.4 /100 | #255 | Tragic $43,416 |
| Alaskan Athabascans | 1.4 /100 | #256 | Tragic $43,393 |
| Jamaicans | 1.3 /100 | #257 | Tragic $43,343 |
| French American Indians | 1.3 /100 | #258 | Tragic $43,333 |
| German Russians | 1.1 /100 | #259 | Tragic $43,200 |
| Immigrants | Somalia | 0.9 /100 | #260 | Tragic $43,100 |
| Immigrants | Jamaica | 0.8 /100 | #261 | Tragic $43,026 |
| Nicaraguans | 0.8 /100 | #262 | Tragic $43,026 |
| Inupiat | 0.8 /100 | #263 | Tragic $43,000 |