Dutch West Indian vs Immigrants from Eritrea Median Household Income
COMPARE
Dutch West Indian
Immigrants from Eritrea
Median Household Income
Median Household Income Comparison
Dutch West Indians
Immigrants from Eritrea
$68,412
MEDIAN HOUSEHOLD INCOME
0.0/ 100
METRIC RATING
329th/ 347
METRIC RANK
$85,025
MEDIAN HOUSEHOLD INCOME
48.8/ 100
METRIC RATING
177th/ 347
METRIC RANK
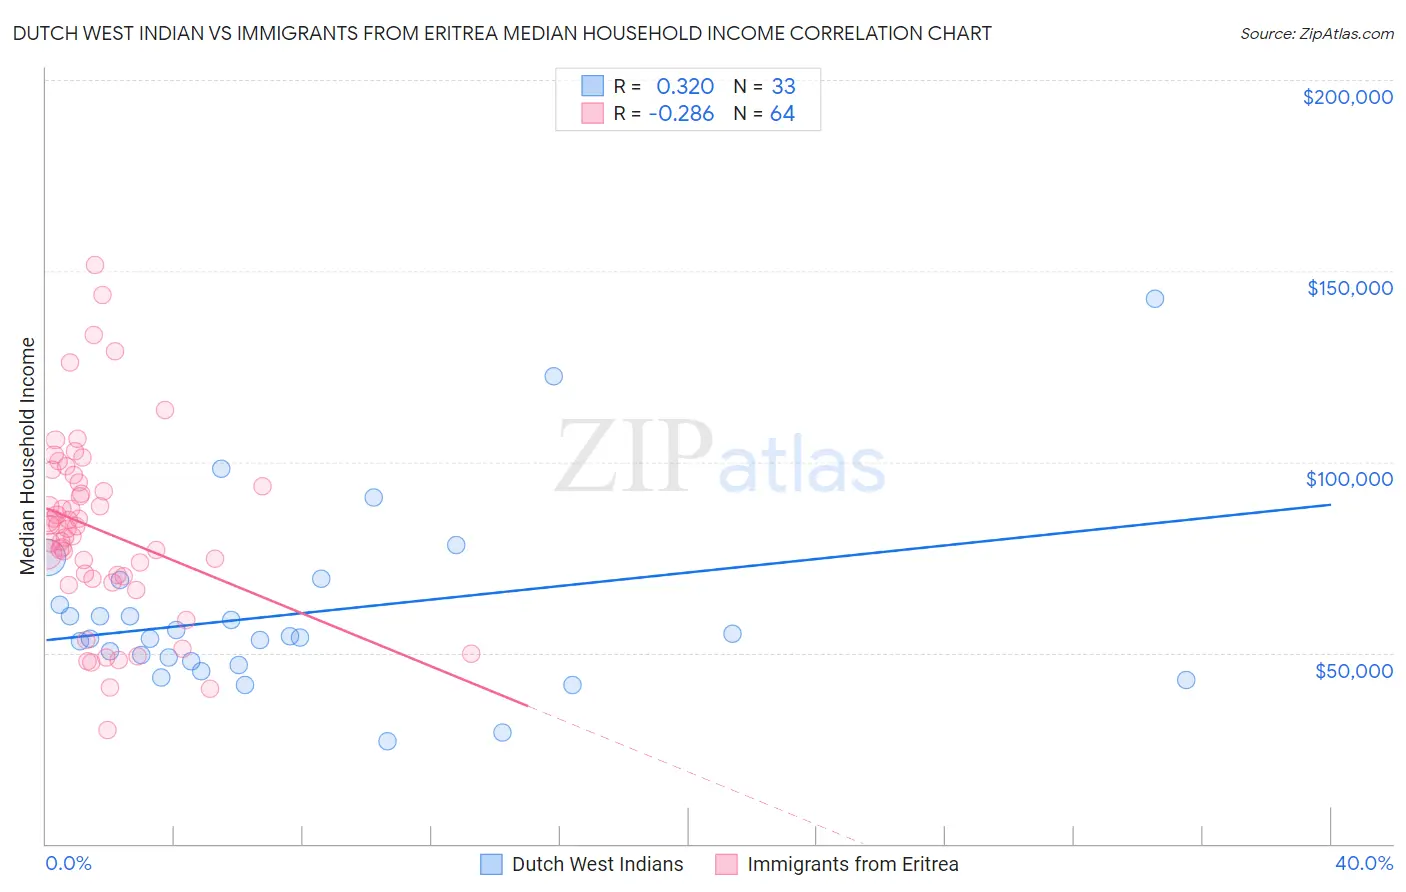
Dutch West Indian vs Immigrants from Eritrea Median Household Income Correlation Chart
The statistical analysis conducted on geographies consisting of 85,760,396 people shows a mild positive correlation between the proportion of Dutch West Indians and median household income in the United States with a correlation coefficient (R) of 0.320 and weighted average of $68,412. Similarly, the statistical analysis conducted on geographies consisting of 104,846,826 people shows a weak negative correlation between the proportion of Immigrants from Eritrea and median household income in the United States with a correlation coefficient (R) of -0.286 and weighted average of $85,025, a difference of 24.3%.
Median Household Income Correlation Summary
| Measurement | Dutch West Indian | Immigrants from Eritrea |
| Minimum | $26,875 | $29,732 |
| Maximum | $142,750 | $151,475 |
| Range | $115,875 | $121,743 |
| Mean | $60,408 | $82,120 |
| Median | $53,986 | $82,729 |
| Interquartile 25% (IQ1) | $47,365 | $69,674 |
| Interquartile 75% (IQ3) | $65,865 | $94,044 |
| Interquartile Range (IQR) | $18,501 | $24,370 |
| Standard Deviation (Sample) | $23,943 | $24,340 |
| Standard Deviation (Population) | $23,577 | $24,149 |
Similar Demographics by Median Household Income
Demographics Similar to Dutch West Indians by Median Household Income
In terms of median household income, the demographic groups most similar to Dutch West Indians are Menominee ($68,423, a difference of 0.020%), Immigrants from Cuba ($68,461, a difference of 0.070%), Yuman ($68,743, a difference of 0.48%), Arapaho ($67,965, a difference of 0.66%), and Native/Alaskan ($67,879, a difference of 0.79%).
| Demographics | Rating | Rank | Median Household Income |
| Choctaw | 0.0 /100 | #322 | Tragic $69,947 |
| Bahamians | 0.0 /100 | #323 | Tragic $69,726 |
| Yup'ik | 0.0 /100 | #324 | Tragic $69,695 |
| Seminole | 0.0 /100 | #325 | Tragic $69,420 |
| Yuman | 0.0 /100 | #326 | Tragic $68,743 |
| Immigrants | Cuba | 0.0 /100 | #327 | Tragic $68,461 |
| Menominee | 0.0 /100 | #328 | Tragic $68,423 |
| Dutch West Indians | 0.0 /100 | #329 | Tragic $68,412 |
| Arapaho | 0.0 /100 | #330 | Tragic $67,965 |
| Natives/Alaskans | 0.0 /100 | #331 | Tragic $67,879 |
| Sioux | 0.0 /100 | #332 | Tragic $67,792 |
| Creek | 0.0 /100 | #333 | Tragic $67,715 |
| Blacks/African Americans | 0.0 /100 | #334 | Tragic $67,573 |
| Cheyenne | 0.0 /100 | #335 | Tragic $66,974 |
| Immigrants | Congo | 0.0 /100 | #336 | Tragic $66,768 |
Demographics Similar to Immigrants from Eritrea by Median Household Income
In terms of median household income, the demographic groups most similar to Immigrants from Eritrea are Immigrants from Costa Rica ($85,054, a difference of 0.030%), Alsatian ($85,053, a difference of 0.030%), Czechoslovakian ($84,965, a difference of 0.070%), Scottish ($85,101, a difference of 0.090%), and English ($84,915, a difference of 0.13%).
| Demographics | Rating | Rank | Median Household Income |
| Swiss | 59.2 /100 | #170 | Average $85,681 |
| Immigrants | South America | 58.1 /100 | #171 | Average $85,611 |
| Slovenes | 57.4 /100 | #172 | Average $85,562 |
| Immigrants | Cameroon | 53.4 /100 | #173 | Average $85,314 |
| Scottish | 50.0 /100 | #174 | Average $85,101 |
| Immigrants | Costa Rica | 49.2 /100 | #175 | Average $85,054 |
| Alsatians | 49.2 /100 | #176 | Average $85,053 |
| Immigrants | Eritrea | 48.8 /100 | #177 | Average $85,025 |
| Czechoslovakians | 47.8 /100 | #178 | Average $84,965 |
| English | 47.0 /100 | #179 | Average $84,915 |
| Immigrants | Portugal | 44.2 /100 | #180 | Average $84,740 |
| Hawaiians | 44.1 /100 | #181 | Average $84,729 |
| Uruguayans | 43.5 /100 | #182 | Average $84,691 |
| Spaniards | 42.7 /100 | #183 | Average $84,644 |
| Immigrants | Eastern Africa | 37.4 /100 | #184 | Fair $84,299 |