Dominican vs Indian (Asian) Per Capita Income
COMPARE
Dominican
Indian (Asian)
Per Capita Income
Per Capita Income Comparison
Dominicans
Indians (Asian)
$37,697
PER CAPITA INCOME
0.1/ 100
METRIC RATING
287th/ 347
METRIC RANK
$53,874
PER CAPITA INCOME
100.0/ 100
METRIC RATING
22nd/ 347
METRIC RANK
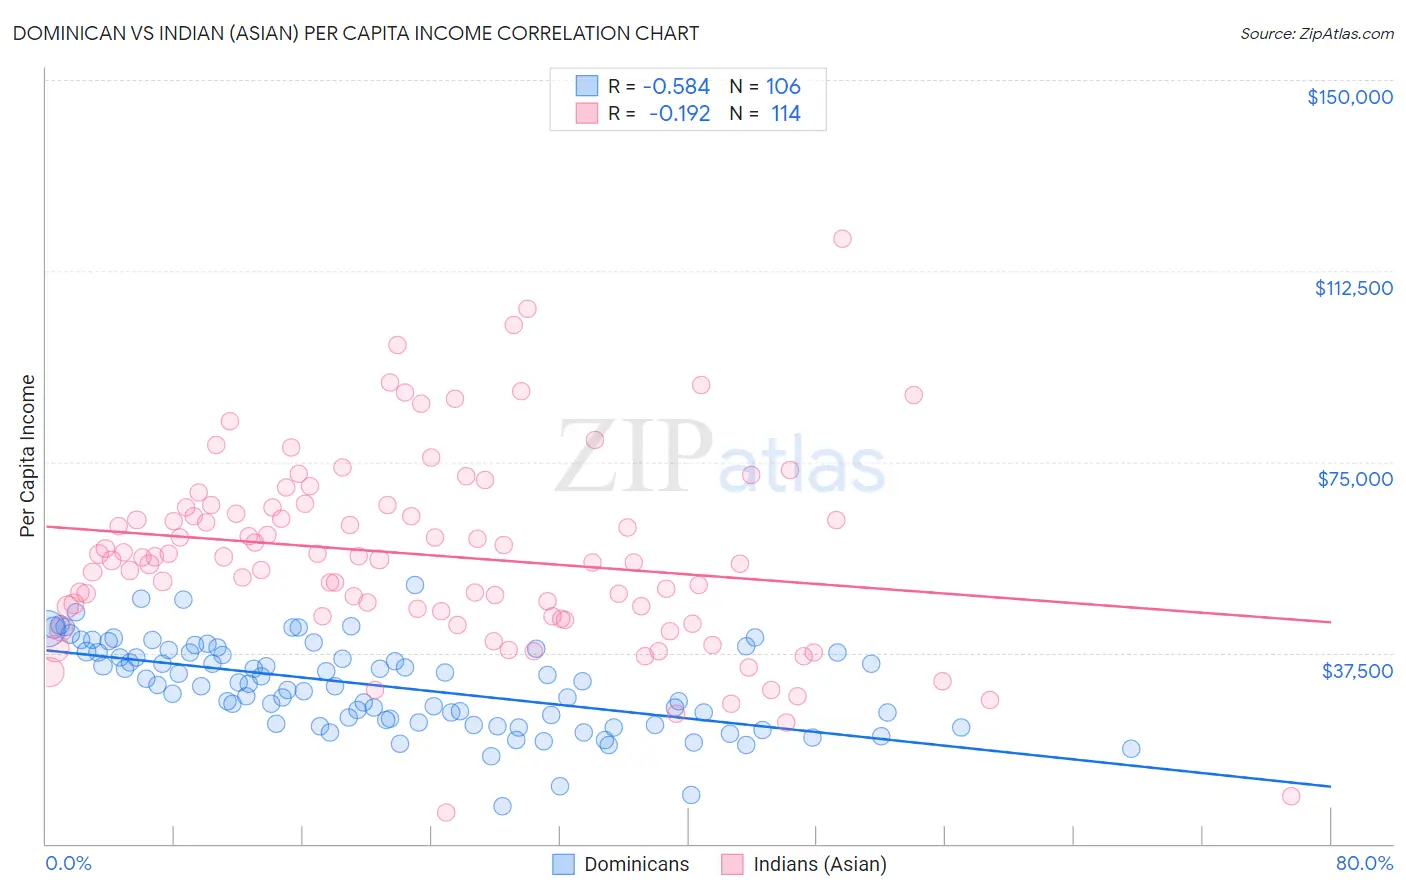
Dominican vs Indian (Asian) Per Capita Income Correlation Chart
The statistical analysis conducted on geographies consisting of 355,170,092 people shows a substantial negative correlation between the proportion of Dominicans and per capita income in the United States with a correlation coefficient (R) of -0.584 and weighted average of $37,697. Similarly, the statistical analysis conducted on geographies consisting of 495,399,283 people shows a poor negative correlation between the proportion of Indians (Asian) and per capita income in the United States with a correlation coefficient (R) of -0.192 and weighted average of $53,874, a difference of 42.9%.
Per Capita Income Correlation Summary
| Measurement | Dominican | Indian (Asian) |
| Minimum | $7,474 | $6,086 |
| Maximum | $50,766 | $118,834 |
| Range | $43,292 | $112,748 |
| Mean | $30,940 | $56,707 |
| Median | $31,292 | $56,072 |
| Interquartile 25% (IQ1) | $23,892 | $44,771 |
| Interquartile 75% (IQ3) | $37,544 | $66,146 |
| Interquartile Range (IQR) | $13,652 | $21,374 |
| Standard Deviation (Sample) | $8,599 | $19,017 |
| Standard Deviation (Population) | $8,559 | $18,934 |
Similar Demographics by Per Capita Income
Demographics Similar to Dominicans by Per Capita Income
In terms of per capita income, the demographic groups most similar to Dominicans are Blackfeet ($37,695, a difference of 0.0%), Central American Indian ($37,699, a difference of 0.010%), Guatemalan ($37,766, a difference of 0.19%), African ($37,785, a difference of 0.24%), and U.S. Virgin Islander ($37,589, a difference of 0.29%).
| Demographics | Rating | Rank | Per Capita Income |
| Potawatomi | 0.2 /100 | #280 | Tragic $38,046 |
| Immigrants | Dominica | 0.2 /100 | #281 | Tragic $37,952 |
| Immigrants | Laos | 0.1 /100 | #282 | Tragic $37,857 |
| Pennsylvania Germans | 0.1 /100 | #283 | Tragic $37,842 |
| Africans | 0.1 /100 | #284 | Tragic $37,785 |
| Guatemalans | 0.1 /100 | #285 | Tragic $37,766 |
| Central American Indians | 0.1 /100 | #286 | Tragic $37,699 |
| Dominicans | 0.1 /100 | #287 | Tragic $37,697 |
| Blackfeet | 0.1 /100 | #288 | Tragic $37,695 |
| U.S. Virgin Islanders | 0.1 /100 | #289 | Tragic $37,589 |
| Immigrants | Guatemala | 0.1 /100 | #290 | Tragic $37,550 |
| Cajuns | 0.1 /100 | #291 | Tragic $37,527 |
| Immigrants | Micronesia | 0.1 /100 | #292 | Tragic $37,464 |
| Mexican American Indians | 0.1 /100 | #293 | Tragic $37,407 |
| Cubans | 0.1 /100 | #294 | Tragic $37,383 |
Demographics Similar to Indians (Asian) by Per Capita Income
In terms of per capita income, the demographic groups most similar to Indians (Asian) are Immigrants from Eastern Asia ($53,806, a difference of 0.13%), Immigrants from Denmark ($53,799, a difference of 0.14%), Immigrants from Northern Europe ($54,159, a difference of 0.53%), Soviet Union ($54,202, a difference of 0.61%), and Immigrants from China ($54,264, a difference of 0.72%).
| Demographics | Rating | Rank | Per Capita Income |
| Cypriots | 100.0 /100 | #15 | Exceptional $54,899 |
| Immigrants | Switzerland | 100.0 /100 | #16 | Exceptional $54,866 |
| Immigrants | France | 100.0 /100 | #17 | Exceptional $54,557 |
| Thais | 100.0 /100 | #18 | Exceptional $54,307 |
| Immigrants | China | 100.0 /100 | #19 | Exceptional $54,264 |
| Soviet Union | 100.0 /100 | #20 | Exceptional $54,202 |
| Immigrants | Northern Europe | 100.0 /100 | #21 | Exceptional $54,159 |
| Indians (Asian) | 100.0 /100 | #22 | Exceptional $53,874 |
| Immigrants | Eastern Asia | 100.0 /100 | #23 | Exceptional $53,806 |
| Immigrants | Denmark | 100.0 /100 | #24 | Exceptional $53,799 |
| Immigrants | Japan | 100.0 /100 | #25 | Exceptional $53,359 |
| Russians | 100.0 /100 | #26 | Exceptional $53,154 |
| Immigrants | South Central Asia | 100.0 /100 | #27 | Exceptional $52,660 |
| Latvians | 100.0 /100 | #28 | Exceptional $52,649 |
| Israelis | 100.0 /100 | #29 | Exceptional $52,596 |