Dominican vs Fijian Per Capita Income
COMPARE
Dominican
Fijian
Per Capita Income
Per Capita Income Comparison
Dominicans
Fijians
$37,697
PER CAPITA INCOME
0.1/ 100
METRIC RATING
287th/ 347
METRIC RANK
$36,690
PER CAPITA INCOME
0.0/ 100
METRIC RATING
308th/ 347
METRIC RANK
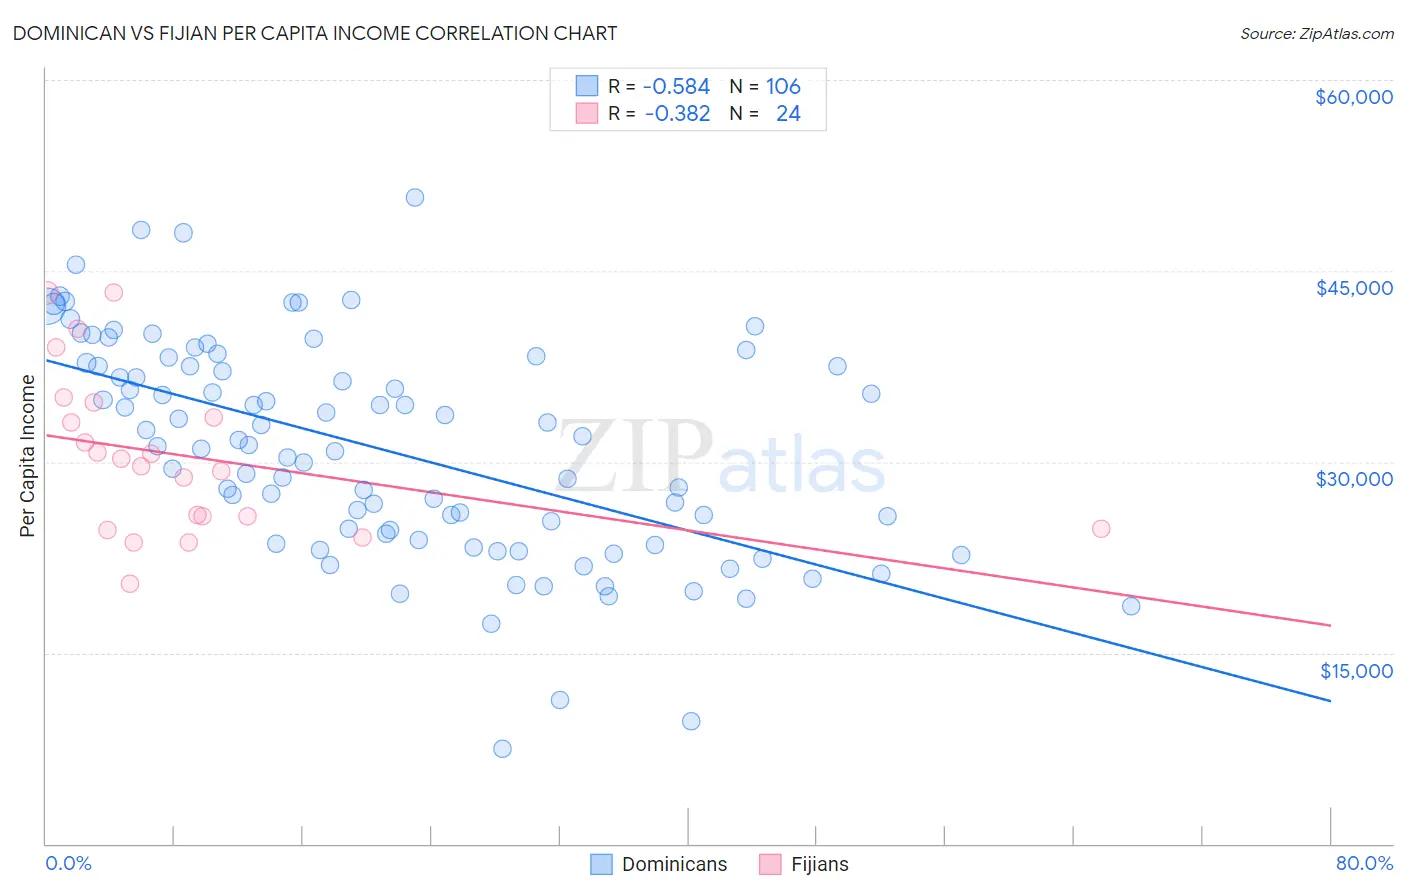
Dominican vs Fijian Per Capita Income Correlation Chart
The statistical analysis conducted on geographies consisting of 355,170,092 people shows a substantial negative correlation between the proportion of Dominicans and per capita income in the United States with a correlation coefficient (R) of -0.584 and weighted average of $37,697. Similarly, the statistical analysis conducted on geographies consisting of 55,948,768 people shows a mild negative correlation between the proportion of Fijians and per capita income in the United States with a correlation coefficient (R) of -0.382 and weighted average of $36,690, a difference of 2.7%.
Per Capita Income Correlation Summary
| Measurement | Dominican | Fijian |
| Minimum | $7,474 | $20,445 |
| Maximum | $50,766 | $43,340 |
| Range | $43,292 | $22,895 |
| Mean | $30,940 | $30,488 |
| Median | $31,292 | $29,934 |
| Interquartile 25% (IQ1) | $23,892 | $25,226 |
| Interquartile 75% (IQ3) | $37,544 | $34,063 |
| Interquartile Range (IQR) | $13,652 | $8,837 |
| Standard Deviation (Sample) | $8,599 | $6,360 |
| Standard Deviation (Population) | $8,559 | $6,227 |
Similar Demographics by Per Capita Income
Demographics Similar to Dominicans by Per Capita Income
In terms of per capita income, the demographic groups most similar to Dominicans are Blackfeet ($37,695, a difference of 0.0%), Central American Indian ($37,699, a difference of 0.010%), Guatemalan ($37,766, a difference of 0.19%), African ($37,785, a difference of 0.24%), and U.S. Virgin Islander ($37,589, a difference of 0.29%).
| Demographics | Rating | Rank | Per Capita Income |
| Potawatomi | 0.2 /100 | #280 | Tragic $38,046 |
| Immigrants | Dominica | 0.2 /100 | #281 | Tragic $37,952 |
| Immigrants | Laos | 0.1 /100 | #282 | Tragic $37,857 |
| Pennsylvania Germans | 0.1 /100 | #283 | Tragic $37,842 |
| Africans | 0.1 /100 | #284 | Tragic $37,785 |
| Guatemalans | 0.1 /100 | #285 | Tragic $37,766 |
| Central American Indians | 0.1 /100 | #286 | Tragic $37,699 |
| Dominicans | 0.1 /100 | #287 | Tragic $37,697 |
| Blackfeet | 0.1 /100 | #288 | Tragic $37,695 |
| U.S. Virgin Islanders | 0.1 /100 | #289 | Tragic $37,589 |
| Immigrants | Guatemala | 0.1 /100 | #290 | Tragic $37,550 |
| Cajuns | 0.1 /100 | #291 | Tragic $37,527 |
| Immigrants | Micronesia | 0.1 /100 | #292 | Tragic $37,464 |
| Mexican American Indians | 0.1 /100 | #293 | Tragic $37,407 |
| Cubans | 0.1 /100 | #294 | Tragic $37,383 |
Demographics Similar to Fijians by Per Capita Income
In terms of per capita income, the demographic groups most similar to Fijians are Immigrants from Honduras ($36,665, a difference of 0.070%), Ute ($36,651, a difference of 0.10%), Chippewa ($36,631, a difference of 0.16%), Immigrants from Latin America ($36,823, a difference of 0.36%), and Immigrants from Haiti ($36,849, a difference of 0.43%).
| Demographics | Rating | Rank | Per Capita Income |
| Ottawa | 0.1 /100 | #301 | Tragic $37,101 |
| Shoshone | 0.1 /100 | #302 | Tragic $37,072 |
| Paiute | 0.1 /100 | #303 | Tragic $37,066 |
| Hondurans | 0.1 /100 | #304 | Tragic $37,031 |
| Inupiat | 0.1 /100 | #305 | Tragic $36,999 |
| Immigrants | Haiti | 0.0 /100 | #306 | Tragic $36,849 |
| Immigrants | Latin America | 0.0 /100 | #307 | Tragic $36,823 |
| Fijians | 0.0 /100 | #308 | Tragic $36,690 |
| Immigrants | Honduras | 0.0 /100 | #309 | Tragic $36,665 |
| Ute | 0.0 /100 | #310 | Tragic $36,651 |
| Chippewa | 0.0 /100 | #311 | Tragic $36,631 |
| Chickasaw | 0.0 /100 | #312 | Tragic $36,475 |
| Bahamians | 0.0 /100 | #313 | Tragic $36,427 |
| Seminole | 0.0 /100 | #314 | Tragic $36,180 |
| Yaqui | 0.0 /100 | #315 | Tragic $36,112 |