Dominican vs Immigrants from England Per Capita Income
COMPARE
Dominican
Immigrants from England
Per Capita Income
Per Capita Income Comparison
Dominicans
Immigrants from England
$37,697
PER CAPITA INCOME
0.1/ 100
METRIC RATING
287th/ 347
METRIC RANK
$48,844
PER CAPITA INCOME
99.7/ 100
METRIC RATING
76th/ 347
METRIC RANK
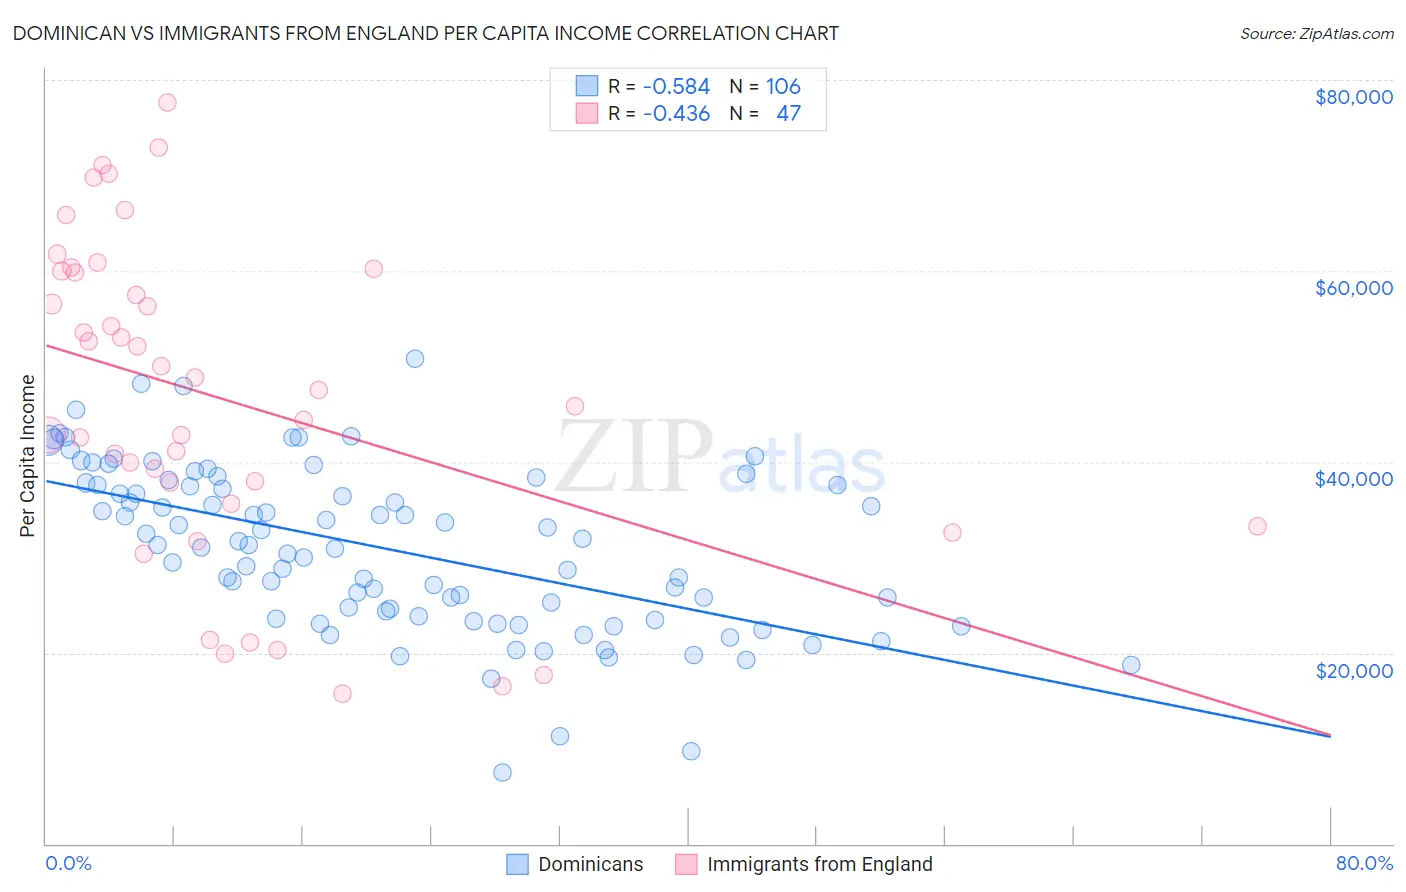
Dominican vs Immigrants from England Per Capita Income Correlation Chart
The statistical analysis conducted on geographies consisting of 355,170,092 people shows a substantial negative correlation between the proportion of Dominicans and per capita income in the United States with a correlation coefficient (R) of -0.584 and weighted average of $37,697. Similarly, the statistical analysis conducted on geographies consisting of 391,908,238 people shows a moderate negative correlation between the proportion of Immigrants from England and per capita income in the United States with a correlation coefficient (R) of -0.436 and weighted average of $48,844, a difference of 29.6%.
Per Capita Income Correlation Summary
| Measurement | Dominican | Immigrants from England |
| Minimum | $7,474 | $15,716 |
| Maximum | $50,766 | $77,696 |
| Range | $43,292 | $61,980 |
| Mean | $30,940 | $46,607 |
| Median | $31,292 | $47,511 |
| Interquartile 25% (IQ1) | $23,892 | $35,676 |
| Interquartile 75% (IQ3) | $37,544 | $59,917 |
| Interquartile Range (IQR) | $13,652 | $24,241 |
| Standard Deviation (Sample) | $8,599 | $16,522 |
| Standard Deviation (Population) | $8,559 | $16,346 |
Similar Demographics by Per Capita Income
Demographics Similar to Dominicans by Per Capita Income
In terms of per capita income, the demographic groups most similar to Dominicans are Blackfeet ($37,695, a difference of 0.0%), Central American Indian ($37,699, a difference of 0.010%), Guatemalan ($37,766, a difference of 0.19%), African ($37,785, a difference of 0.24%), and U.S. Virgin Islander ($37,589, a difference of 0.29%).
| Demographics | Rating | Rank | Per Capita Income |
| Potawatomi | 0.2 /100 | #280 | Tragic $38,046 |
| Immigrants | Dominica | 0.2 /100 | #281 | Tragic $37,952 |
| Immigrants | Laos | 0.1 /100 | #282 | Tragic $37,857 |
| Pennsylvania Germans | 0.1 /100 | #283 | Tragic $37,842 |
| Africans | 0.1 /100 | #284 | Tragic $37,785 |
| Guatemalans | 0.1 /100 | #285 | Tragic $37,766 |
| Central American Indians | 0.1 /100 | #286 | Tragic $37,699 |
| Dominicans | 0.1 /100 | #287 | Tragic $37,697 |
| Blackfeet | 0.1 /100 | #288 | Tragic $37,695 |
| U.S. Virgin Islanders | 0.1 /100 | #289 | Tragic $37,589 |
| Immigrants | Guatemala | 0.1 /100 | #290 | Tragic $37,550 |
| Cajuns | 0.1 /100 | #291 | Tragic $37,527 |
| Immigrants | Micronesia | 0.1 /100 | #292 | Tragic $37,464 |
| Mexican American Indians | 0.1 /100 | #293 | Tragic $37,407 |
| Cubans | 0.1 /100 | #294 | Tragic $37,383 |
Demographics Similar to Immigrants from England by Per Capita Income
In terms of per capita income, the demographic groups most similar to Immigrants from England are Immigrants from Kazakhstan ($48,747, a difference of 0.20%), Immigrants from Bolivia ($48,970, a difference of 0.26%), Immigrants from Italy ($48,654, a difference of 0.39%), Mongolian ($49,173, a difference of 0.67%), and Romanian ($48,445, a difference of 0.82%).
| Demographics | Rating | Rank | Per Capita Income |
| Immigrants | Canada | 99.8 /100 | #69 | Exceptional $49,412 |
| Immigrants | Eastern Europe | 99.8 /100 | #70 | Exceptional $49,316 |
| Greeks | 99.8 /100 | #71 | Exceptional $49,309 |
| Immigrants | Hungary | 99.8 /100 | #72 | Exceptional $49,303 |
| Immigrants | North America | 99.8 /100 | #73 | Exceptional $49,302 |
| Mongolians | 99.8 /100 | #74 | Exceptional $49,173 |
| Immigrants | Bolivia | 99.7 /100 | #75 | Exceptional $48,970 |
| Immigrants | England | 99.7 /100 | #76 | Exceptional $48,844 |
| Immigrants | Kazakhstan | 99.7 /100 | #77 | Exceptional $48,747 |
| Immigrants | Italy | 99.6 /100 | #78 | Exceptional $48,654 |
| Romanians | 99.5 /100 | #79 | Exceptional $48,445 |
| Egyptians | 99.5 /100 | #80 | Exceptional $48,358 |
| Armenians | 99.4 /100 | #81 | Exceptional $48,287 |
| Immigrants | Indonesia | 99.4 /100 | #82 | Exceptional $48,195 |
| Immigrants | Brazil | 99.4 /100 | #83 | Exceptional $48,164 |