Dominican vs Indian (Asian) Female Unemployment

COMPARE

Dominican
Race
Ancestry
AfghanAfricanAlaska NativeAlaskan AthabascanAlbanianAleutAlsatianAmericanApacheArabArapahoArgentineanArmenianAssyrian/Chaldean/SyriacAustralianAustrianBahamianBangladeshiBarbadianBasqueBelgianBelizeanBermudanBhutaneseBlackfeetBolivianBrazilianBritishBritish West IndianBulgarianBurmeseCajunCambodianCanadianCape VerdeanCarpatho RusynCelticCentral AmericanCentral American IndianCherokeeCheyenneChickasawChileanChineseChippewaChoctawColombianColvilleComancheCosta RicanCreeCreekCroatianCrowCubanCypriotCzechCzechoslovakianDanishDelawareDominicanDutchDutch West IndianEastern EuropeanEcuadorianEgyptianEnglishEstonianEthiopianEuropeanFijianFilipinoFinnishFrenchFrench American IndianFrench CanadianGermanGerman RussianGhanaianGreekGuamanian/ChamorroGuatemalanGuyaneseHaitianHmongHonduranHopiHoumaHungarianIcelanderIndonesianInupiatIranianIraqiIrishIroquoisIsraeliItalianJamaicanJapaneseJordanianKenyanKiowaKoreanLaotianLatvianLebaneseLiberianLithuanianLumbeeLuxembourgerMacedonianMalaysianMalteseMarshalleseMenomineeMexicanMexican American IndianMongolianMoroccanNative HawaiianNavajoNepaleseNew ZealanderNicaraguanNigerianNorthern EuropeanNorwegianOkinawanOsageOttawaPaiutePakistaniPalestinianPanamanianParaguayanPennsylvania GermanPeruvianPimaPolishPortuguesePotawatomiPuebloPuerto RicanPuget Sound SalishRomanianRussianSalvadoranSamoanScandinavianScotch-IrishScottishSeminoleSenegaleseSerbianShoshoneSierra LeoneanSiouxSlavicSlovakSloveneSomaliSouth AfricanSouth AmericanSouth American IndianSoviet UnionSpaniardSpanishSpanish AmericanSpanish American IndianSri LankanSubsaharan AfricanSudaneseSwedishSwissSyrianTaiwaneseThaiTlingit-HaidaTohono O'OdhamTonganTrinidadian and TobagonianTsimshianTurkishU.S. Virgin IslanderUgandanUkrainianUruguayanUteVenezuelanVietnameseWelshWest IndianYakamaYaquiYugoslavianYumanYup'ikZimbabwean
Immigration
NonimmigrantsImmigrantsAfghanistanAfricaAlbaniaArgentinaArmeniaAsiaAustraliaAustriaBahamasBangladeshBarbadosBelarusBelgiumBelizeBoliviaBosnia and HerzegovinaBrazilBulgariaBurma/MyanmarCabo VerdeCambodiaCameroonCanadaCaribbeanCentral AmericaChileChinaColombiaCongoCosta RicaCroatiaCubaCzechoslovakiaDenmarkDominicaDominican RepublicEastern AfricaEastern AsiaEastern EuropeEcuadorEgyptEl SalvadorEnglandEritreaEthiopiaEuropeFijiFranceGermanyGhanaGreeceGrenadaGuatemalaGuyanaHaitiHondurasHong KongHungaryIndiaIndonesiaIranIraqIrelandIsraelItalyJamaicaJapanJordanKazakhstanKenyaKoreaKuwaitLaosLatin AmericaLatviaLebanonLiberiaLithuaniaMalaysiaMexicoMicronesiaMiddle AfricaMoldovaMoroccoNepalNetherlandsNicaraguaNigeriaNorth AmericaNorth MacedoniaNorthern AfricaNorthern EuropeNorwayOceaniaPakistanPanamaPeruPhilippinesPolandPortugalRomaniaRussiaSaudi ArabiaScotlandSenegalSerbiaSierra LeoneSingaporeSomaliaSouth AfricaSouth AmericaSouth Central AsiaSouth Eastern AsiaSouthern EuropeSpainSri LankaSt. Vincent and the GrenadinesSudanSwedenSwitzerlandSyriaTaiwanThailandTrinidad and TobagoTurkeyUgandaUkraineUruguayUzbekistanVenezuelaVietnamWest IndiesWestern AfricaWestern AsiaWestern EuropeYemenZaireZimbabweAzores
Indian (Asian)
Race
Ancestry
AfghanAfricanAlaska NativeAlaskan AthabascanAlbanianAleutAlsatianAmericanApacheArabArapahoArgentineanArmenianAssyrian/Chaldean/SyriacAustralianAustrianBahamianBangladeshiBarbadianBasqueBelgianBelizeanBermudanBhutaneseBlackfeetBolivianBrazilianBritishBritish West IndianBulgarianBurmeseCajunCambodianCanadianCape VerdeanCarpatho RusynCelticCentral AmericanCentral American IndianCherokeeCheyenneChickasawChileanChineseChippewaChoctawColombianColvilleComancheCosta RicanCreeCreekCroatianCrowCubanCypriotCzechCzechoslovakianDanishDelawareDutchDutch West IndianEastern EuropeanEcuadorianEgyptianEnglishEstonianEthiopianEuropeanFijianFilipinoFinnishFrenchFrench American IndianFrench CanadianGermanGerman RussianGhanaianGreekGuamanian/ChamorroGuatemalanGuyaneseHaitianHmongHonduranHopiHoumaHungarianIcelanderIndian (Asian)IndonesianInupiatIranianIraqiIrishIroquoisIsraeliItalianJamaicanJapaneseJordanianKenyanKiowaKoreanLaotianLatvianLebaneseLiberianLithuanianLumbeeLuxembourgerMacedonianMalaysianMalteseMarshalleseMenomineeMexicanMexican American IndianMongolianMoroccanNative HawaiianNavajoNepaleseNew ZealanderNicaraguanNigerianNorthern EuropeanNorwegianOkinawanOsageOttawaPaiutePakistaniPalestinianPanamanianParaguayanPennsylvania GermanPeruvianPimaPolishPortuguesePotawatomiPuebloPuerto RicanPuget Sound SalishRomanianRussianSalvadoranSamoanScandinavianScotch-IrishScottishSeminoleSenegaleseSerbianShoshoneSierra LeoneanSiouxSlavicSlovakSloveneSomaliSouth AfricanSouth AmericanSouth American IndianSoviet UnionSpaniardSpanishSpanish AmericanSpanish American IndianSri LankanSubsaharan AfricanSudaneseSwedishSwissSyrianTaiwaneseThaiTlingit-HaidaTohono O'OdhamTonganTrinidadian and TobagonianTsimshianTurkishU.S. Virgin IslanderUgandanUkrainianUruguayanUteVenezuelanVietnameseWelshWest IndianYakamaYaquiYugoslavianYumanYup'ikZimbabwean
Immigration
NonimmigrantsImmigrantsAfghanistanAfricaAlbaniaArgentinaArmeniaAsiaAustraliaAustriaBahamasBangladeshBarbadosBelarusBelgiumBelizeBoliviaBosnia and HerzegovinaBrazilBulgariaBurma/MyanmarCabo VerdeCambodiaCameroonCanadaCaribbeanCentral AmericaChileChinaColombiaCongoCosta RicaCroatiaCubaCzechoslovakiaDenmarkDominicaDominican RepublicEastern AfricaEastern AsiaEastern EuropeEcuadorEgyptEl SalvadorEnglandEritreaEthiopiaEuropeFijiFranceGermanyGhanaGreeceGrenadaGuatemalaGuyanaHaitiHondurasHong KongHungaryIndiaIndonesiaIranIraqIrelandIsraelItalyJamaicaJapanJordanKazakhstanKenyaKoreaKuwaitLaosLatin AmericaLatviaLebanonLiberiaLithuaniaMalaysiaMexicoMicronesiaMiddle AfricaMoldovaMoroccoNepalNetherlandsNicaraguaNigeriaNorth AmericaNorth MacedoniaNorthern AfricaNorthern EuropeNorwayOceaniaPakistanPanamaPeruPhilippinesPolandPortugalRomaniaRussiaSaudi ArabiaScotlandSenegalSerbiaSierra LeoneSingaporeSomaliaSouth AfricaSouth AmericaSouth Central AsiaSouth Eastern AsiaSouthern EuropeSpainSri LankaSt. Vincent and the GrenadinesSudanSwedenSwitzerlandSyriaTaiwanThailandTrinidad and TobagoTurkeyUgandaUkraineUruguayUzbekistanVenezuelaVietnamWest IndiesWestern AfricaWestern AsiaWestern EuropeYemenZaireZimbabweAzores
Female Unemployment
Income
Poverty
Unemployment
Labor Participation
Family Structure
Vehicle Availability
Education Level
Disability

Female Unemployment Comparison

Dominicans

Indians (Asian)

Tragic
Excellent
7.2%
FEMALE UNEMPLOYMENT
0.0/ 100
METRIC RATING
335th/ 347
METRIC RANK
5.1%
FEMALE UNEMPLOYMENT
84.2/ 100
METRIC RATING
136th/ 347
METRIC RANK

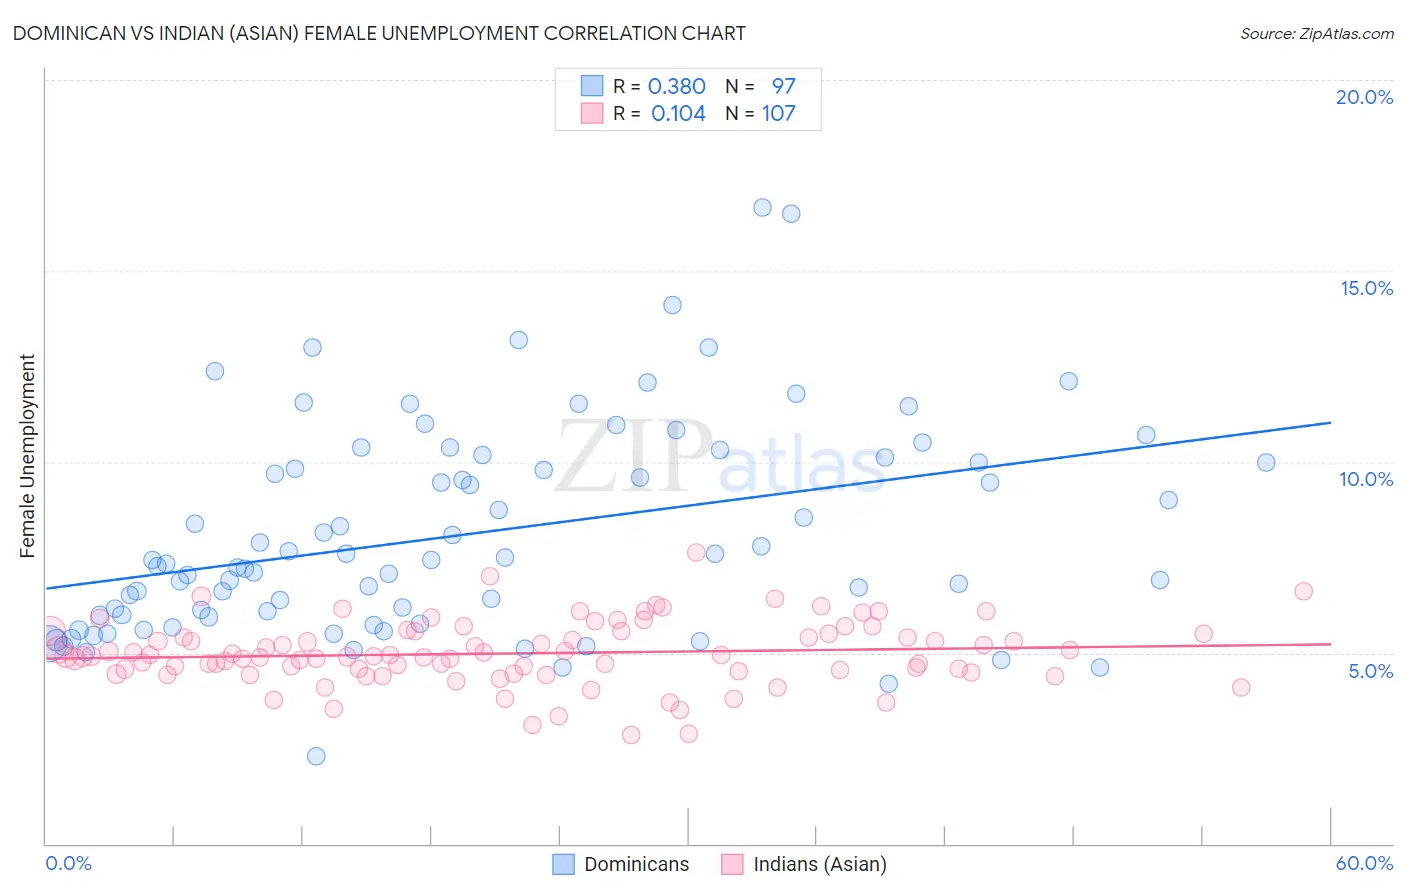
Dominican vs Indian (Asian) Female Unemployment Correlation Chart

The statistical analysis conducted on geographies consisting of 353,758,930 people shows a mild positive correlation between the proportion of Dominicans and unemploymnet rate among females in the United States with a correlation coefficient (R) of 0.380 and weighted average of 7.2%. Similarly, the statistical analysis conducted on geographies consisting of 491,024,006 people shows a poor positive correlation between the proportion of Indians (Asian) and unemploymnet rate among females in the United States with a correlation coefficient (R) of 0.104 and weighted average of 5.1%, a difference of 40.0%.
Dominican vs Indian (Asian) Female Unemployment

Female Unemployment Correlation Summary

MeasurementDominicanIndian (Asian)
Minimum2.3%2.9%
Maximum16.7%7.6%
Range14.4%4.8%
Mean8.1%5.0%
Median7.4%4.9%
Interquartile 25% (IQ1)6.0%4.5%
Interquartile 75% (IQ3)10.1%5.5%
Interquartile Range (IQR)4.1%0.98%
Standard Deviation (Sample)2.8%0.84%
Standard Deviation (Population)2.7%0.84%

Similar Demographics by Female Unemployment

Demographics Similar to Dominicans by Female Unemployment

In terms of female unemployment, the demographic groups most similar to Dominicans are Immigrants from Dominican Republic (7.2%, a difference of 0.64%), Immigrants from Armenia (7.1%, a difference of 1.4%), Navajo (7.3%, a difference of 1.6%), Menominee (7.0%, a difference of 1.8%), and Sioux (7.0%, a difference of 1.8%).
DemographicsRating | RankFemale Unemployment
Guyanese
0.0
/100
|
#328
Tragic
6.7%
Immigrants | Guyana
0.0
/100
|
#329
Tragic
6.7%
Yakama
0.0
/100
|
#330
Tragic
6.7%
Paiute
0.0
/100
|
#331
Tragic
6.8%
Sioux
0.0
/100
|
#332
Tragic
7.0%
Menominee
0.0
/100
|
#333
Tragic
7.0%
Immigrants | Armenia
0.0
/100
|
#334
Tragic
7.1%
Dominicans
0.0
/100
|
#335
Tragic
7.2%
Immigrants | Dominican Republic
0.0
/100
|
#336
Tragic
7.2%
Navajo
0.0
/100
|
#337
Tragic
7.3%
Tohono O'odham
0.0
/100
|
#338
Tragic
7.7%
Immigrants | Yemen
0.0
/100
|
#339
Tragic
7.8%
Hopi
0.0
/100
|
#340
Tragic
8.1%
Inupiat
0.0
/100
|
#341
Tragic
8.2%
Puerto Ricans
0.0
/100
|
#342
Tragic
8.3%

Demographics Similar to Indians (Asian) by Female Unemployment

In terms of female unemployment, the demographic groups most similar to Indians (Asian) are Pakistani (5.1%, a difference of 0.040%), Immigrants from Eritrea (5.1%, a difference of 0.050%), Immigrants from Latvia (5.1%, a difference of 0.050%), Immigrants from Hong Kong (5.1%, a difference of 0.070%), and Immigrants from Sri Lanka (5.1%, a difference of 0.090%).
DemographicsRating | RankFemale Unemployment
Ethiopians
85.7
/100
|
#129
Excellent
5.1%
Maltese
85.5
/100
|
#130
Excellent
5.1%
Immigrants | Ethiopia
85.4
/100
|
#131
Excellent
5.1%
Immigrants | Sri Lanka
85.0
/100
|
#132
Excellent
5.1%
Immigrants | Hong Kong
84.8
/100
|
#133
Excellent
5.1%
Immigrants | Eritrea
84.6
/100
|
#134
Excellent
5.1%
Immigrants | Latvia
84.6
/100
|
#135
Excellent
5.1%
Indians (Asian)
84.2
/100
|
#136
Excellent
5.1%
Pakistanis
83.8
/100
|
#137
Excellent
5.1%
Chickasaw
83.2
/100
|
#138
Excellent
5.1%
Immigrants | Eastern Asia
83.0
/100
|
#139
Excellent
5.1%
Immigrants | France
82.7
/100
|
#140
Excellent
5.1%
Immigrants | Eastern Europe
81.5
/100
|
#141
Excellent
5.1%
Palestinians
80.8
/100
|
#142
Excellent
5.1%
Immigrants | Kazakhstan
80.7
/100
|
#143
Excellent
5.1%