Dominican vs South African Per Capita Income
COMPARE
Dominican
South African
Per Capita Income
Per Capita Income Comparison
Dominicans
South Africans
$37,697
PER CAPITA INCOME
0.1/ 100
METRIC RATING
287th/ 347
METRIC RANK
$50,044
PER CAPITA INCOME
99.9/ 100
METRIC RATING
57th/ 347
METRIC RANK
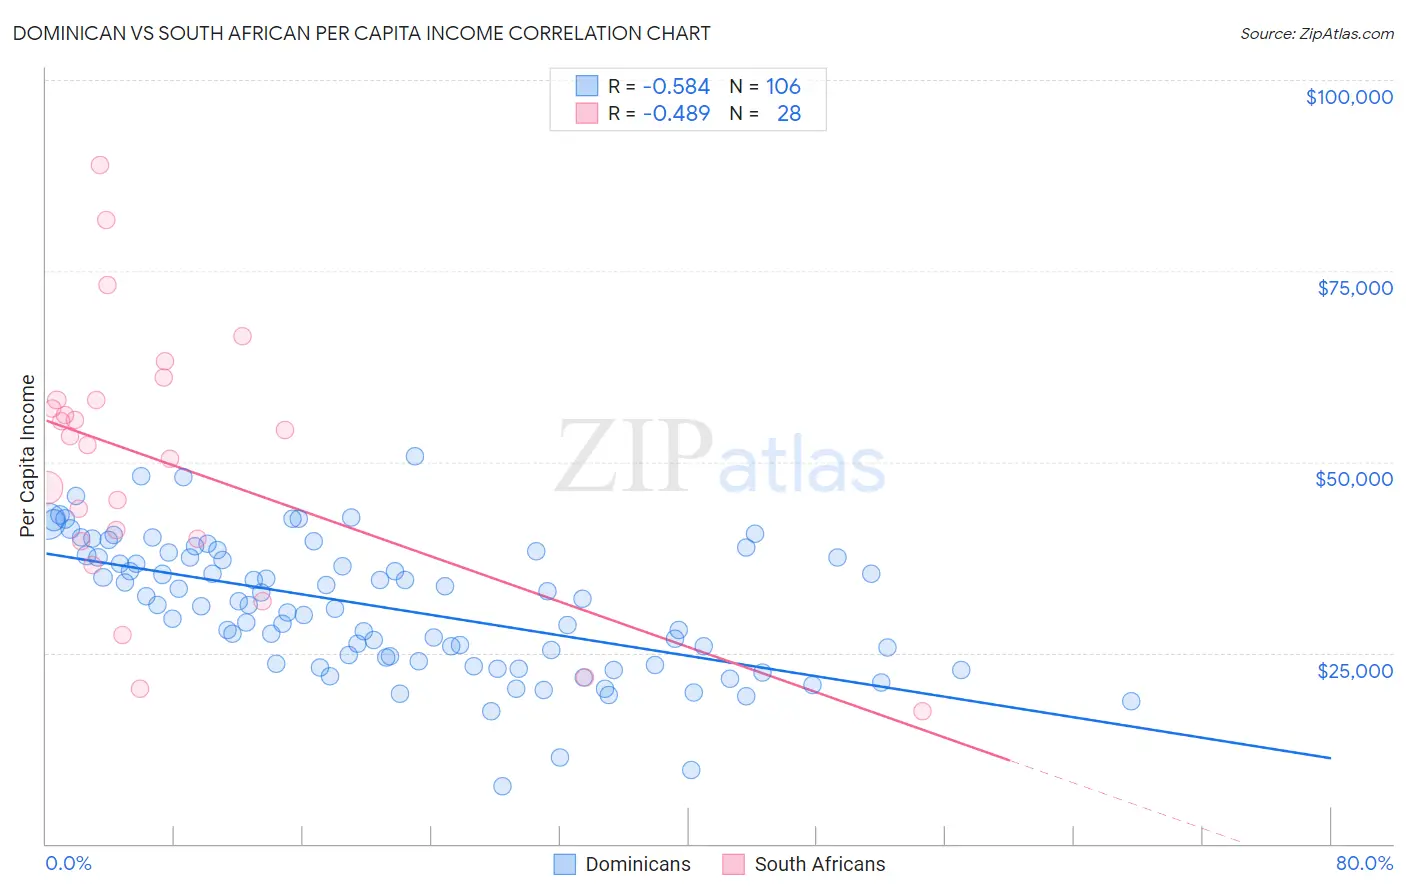
Dominican vs South African Per Capita Income Correlation Chart
The statistical analysis conducted on geographies consisting of 355,170,092 people shows a substantial negative correlation between the proportion of Dominicans and per capita income in the United States with a correlation coefficient (R) of -0.584 and weighted average of $37,697. Similarly, the statistical analysis conducted on geographies consisting of 182,604,546 people shows a moderate negative correlation between the proportion of South Africans and per capita income in the United States with a correlation coefficient (R) of -0.489 and weighted average of $50,044, a difference of 32.8%.
Per Capita Income Correlation Summary
| Measurement | Dominican | South African |
| Minimum | $7,474 | $17,364 |
| Maximum | $50,766 | $88,818 |
| Range | $43,292 | $71,454 |
| Mean | $30,940 | $49,855 |
| Median | $31,292 | $52,728 |
| Interquartile 25% (IQ1) | $23,892 | $39,824 |
| Interquartile 75% (IQ3) | $37,544 | $58,137 |
| Interquartile Range (IQR) | $13,652 | $18,313 |
| Standard Deviation (Sample) | $8,599 | $17,281 |
| Standard Deviation (Population) | $8,559 | $16,970 |
Similar Demographics by Per Capita Income
Demographics Similar to Dominicans by Per Capita Income
In terms of per capita income, the demographic groups most similar to Dominicans are Blackfeet ($37,695, a difference of 0.0%), Central American Indian ($37,699, a difference of 0.010%), Guatemalan ($37,766, a difference of 0.19%), African ($37,785, a difference of 0.24%), and U.S. Virgin Islander ($37,589, a difference of 0.29%).
| Demographics | Rating | Rank | Per Capita Income |
| Potawatomi | 0.2 /100 | #280 | Tragic $38,046 |
| Immigrants | Dominica | 0.2 /100 | #281 | Tragic $37,952 |
| Immigrants | Laos | 0.1 /100 | #282 | Tragic $37,857 |
| Pennsylvania Germans | 0.1 /100 | #283 | Tragic $37,842 |
| Africans | 0.1 /100 | #284 | Tragic $37,785 |
| Guatemalans | 0.1 /100 | #285 | Tragic $37,766 |
| Central American Indians | 0.1 /100 | #286 | Tragic $37,699 |
| Dominicans | 0.1 /100 | #287 | Tragic $37,697 |
| Blackfeet | 0.1 /100 | #288 | Tragic $37,695 |
| U.S. Virgin Islanders | 0.1 /100 | #289 | Tragic $37,589 |
| Immigrants | Guatemala | 0.1 /100 | #290 | Tragic $37,550 |
| Cajuns | 0.1 /100 | #291 | Tragic $37,527 |
| Immigrants | Micronesia | 0.1 /100 | #292 | Tragic $37,464 |
| Mexican American Indians | 0.1 /100 | #293 | Tragic $37,407 |
| Cubans | 0.1 /100 | #294 | Tragic $37,383 |
Demographics Similar to South Africans by Per Capita Income
In terms of per capita income, the demographic groups most similar to South Africans are Asian ($50,057, a difference of 0.030%), Immigrants from Western Europe ($50,065, a difference of 0.040%), Immigrants from Malaysia ($49,983, a difference of 0.12%), Bhutanese ($49,894, a difference of 0.30%), and Immigrants from Scotland ($49,893, a difference of 0.30%).
| Demographics | Rating | Rank | Per Capita Income |
| Immigrants | Sri Lanka | 100.0 /100 | #50 | Exceptional $50,555 |
| Immigrants | Netherlands | 100.0 /100 | #51 | Exceptional $50,458 |
| Immigrants | Croatia | 99.9 /100 | #52 | Exceptional $50,417 |
| Paraguayans | 99.9 /100 | #53 | Exceptional $50,385 |
| Immigrants | Belarus | 99.9 /100 | #54 | Exceptional $50,303 |
| Immigrants | Western Europe | 99.9 /100 | #55 | Exceptional $50,065 |
| Asians | 99.9 /100 | #56 | Exceptional $50,057 |
| South Africans | 99.9 /100 | #57 | Exceptional $50,044 |
| Immigrants | Malaysia | 99.9 /100 | #58 | Exceptional $49,983 |
| Bhutanese | 99.9 /100 | #59 | Exceptional $49,894 |
| Immigrants | Scotland | 99.9 /100 | #60 | Exceptional $49,893 |
| Argentineans | 99.9 /100 | #61 | Exceptional $49,862 |
| Immigrants | Asia | 99.9 /100 | #62 | Exceptional $49,741 |
| Maltese | 99.9 /100 | #63 | Exceptional $49,640 |
| Immigrants | Argentina | 99.9 /100 | #64 | Exceptional $49,627 |