Sudanese vs Indian (Asian) Per Capita Income
COMPARE
Sudanese
Indian (Asian)
Per Capita Income
Per Capita Income Comparison
Sudanese
Indians (Asian)
$41,695
PER CAPITA INCOME
9.9/ 100
METRIC RATING
215th/ 347
METRIC RANK
$53,874
PER CAPITA INCOME
100.0/ 100
METRIC RATING
22nd/ 347
METRIC RANK
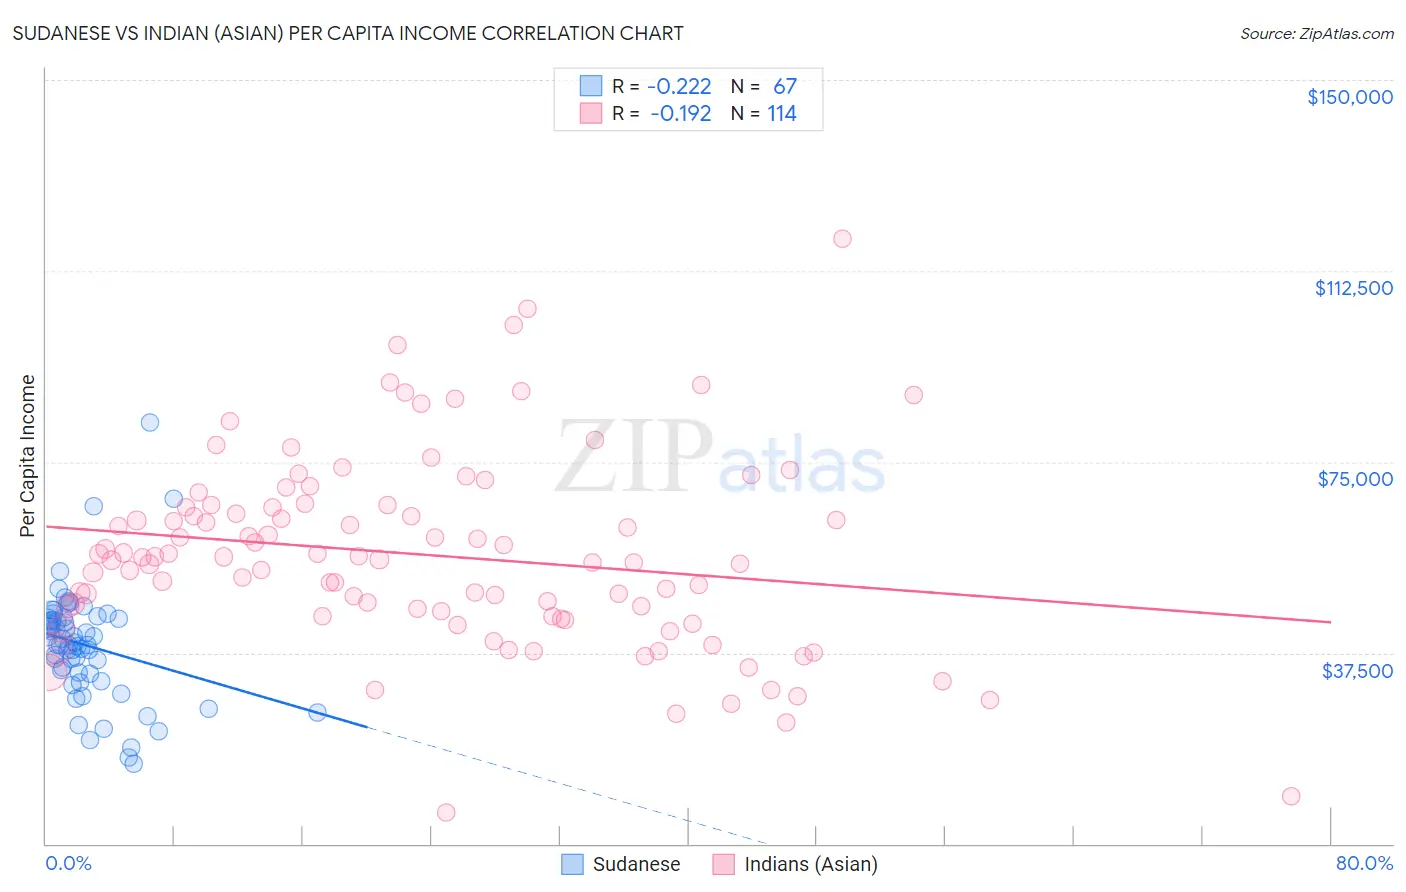
Sudanese vs Indian (Asian) Per Capita Income Correlation Chart
The statistical analysis conducted on geographies consisting of 110,152,165 people shows a weak negative correlation between the proportion of Sudanese and per capita income in the United States with a correlation coefficient (R) of -0.222 and weighted average of $41,695. Similarly, the statistical analysis conducted on geographies consisting of 495,399,283 people shows a poor negative correlation between the proportion of Indians (Asian) and per capita income in the United States with a correlation coefficient (R) of -0.192 and weighted average of $53,874, a difference of 29.2%.
Per Capita Income Correlation Summary
| Measurement | Sudanese | Indian (Asian) |
| Minimum | $15,628 | $6,086 |
| Maximum | $82,685 | $118,834 |
| Range | $67,057 | $112,748 |
| Mean | $38,981 | $56,707 |
| Median | $39,137 | $56,072 |
| Interquartile 25% (IQ1) | $33,494 | $44,771 |
| Interquartile 75% (IQ3) | $44,276 | $66,146 |
| Interquartile Range (IQR) | $10,782 | $21,374 |
| Standard Deviation (Sample) | $11,237 | $19,017 |
| Standard Deviation (Population) | $11,153 | $18,934 |
Similar Demographics by Per Capita Income
Demographics Similar to Sudanese by Per Capita Income
In terms of per capita income, the demographic groups most similar to Sudanese are Tongan ($41,693, a difference of 0.010%), Immigrants from Bangladesh ($41,709, a difference of 0.030%), Guamanian/Chamorro ($41,678, a difference of 0.040%), Immigrants from Venezuela ($41,727, a difference of 0.080%), and Trinidadian and Tobagonian ($41,655, a difference of 0.10%).
| Demographics | Rating | Rank | Per Capita Income |
| Panamanians | 13.9 /100 | #208 | Poor $42,035 |
| Immigrants | Sudan | 13.2 /100 | #209 | Poor $41,986 |
| Ecuadorians | 12.9 /100 | #210 | Poor $41,958 |
| Immigrants | Panama | 11.6 /100 | #211 | Poor $41,853 |
| Immigrants | Senegal | 11.3 /100 | #212 | Poor $41,830 |
| Immigrants | Venezuela | 10.2 /100 | #213 | Poor $41,727 |
| Immigrants | Bangladesh | 10.1 /100 | #214 | Poor $41,709 |
| Sudanese | 9.9 /100 | #215 | Tragic $41,695 |
| Tongans | 9.9 /100 | #216 | Tragic $41,693 |
| Guamanians/Chamorros | 9.7 /100 | #217 | Tragic $41,678 |
| Trinidadians and Tobagonians | 9.5 /100 | #218 | Tragic $41,655 |
| Puget Sound Salish | 8.1 /100 | #219 | Tragic $41,495 |
| Immigrants | Barbados | 7.9 /100 | #220 | Tragic $41,478 |
| Immigrants | Trinidad and Tobago | 7.9 /100 | #221 | Tragic $41,476 |
| Immigrants | Iraq | 7.1 /100 | #222 | Tragic $41,365 |
Demographics Similar to Indians (Asian) by Per Capita Income
In terms of per capita income, the demographic groups most similar to Indians (Asian) are Immigrants from Eastern Asia ($53,806, a difference of 0.13%), Immigrants from Denmark ($53,799, a difference of 0.14%), Immigrants from Northern Europe ($54,159, a difference of 0.53%), Soviet Union ($54,202, a difference of 0.61%), and Immigrants from China ($54,264, a difference of 0.72%).
| Demographics | Rating | Rank | Per Capita Income |
| Cypriots | 100.0 /100 | #15 | Exceptional $54,899 |
| Immigrants | Switzerland | 100.0 /100 | #16 | Exceptional $54,866 |
| Immigrants | France | 100.0 /100 | #17 | Exceptional $54,557 |
| Thais | 100.0 /100 | #18 | Exceptional $54,307 |
| Immigrants | China | 100.0 /100 | #19 | Exceptional $54,264 |
| Soviet Union | 100.0 /100 | #20 | Exceptional $54,202 |
| Immigrants | Northern Europe | 100.0 /100 | #21 | Exceptional $54,159 |
| Indians (Asian) | 100.0 /100 | #22 | Exceptional $53,874 |
| Immigrants | Eastern Asia | 100.0 /100 | #23 | Exceptional $53,806 |
| Immigrants | Denmark | 100.0 /100 | #24 | Exceptional $53,799 |
| Immigrants | Japan | 100.0 /100 | #25 | Exceptional $53,359 |
| Russians | 100.0 /100 | #26 | Exceptional $53,154 |
| Immigrants | South Central Asia | 100.0 /100 | #27 | Exceptional $52,660 |
| Latvians | 100.0 /100 | #28 | Exceptional $52,649 |
| Israelis | 100.0 /100 | #29 | Exceptional $52,596 |