Dominican vs Indian (Asian) Unemployment Among Women with Children Under 18 years
COMPARE
Dominican
Indian (Asian)
Unemployment Among Women with Children Under 18 years
Unemployment Among Women with Children Under 18 years Comparison
Dominicans
Indians (Asian)
7.5%
UNEMPLOYMENT AMONG WOMEN WITH CHILDREN UNDER 18 YEARS
0.0/ 100
METRIC RATING
332nd/ 347
METRIC RANK
4.9%
UNEMPLOYMENT AMONG WOMEN WITH CHILDREN UNDER 18 YEARS
99.6/ 100
METRIC RATING
22nd/ 347
METRIC RANK
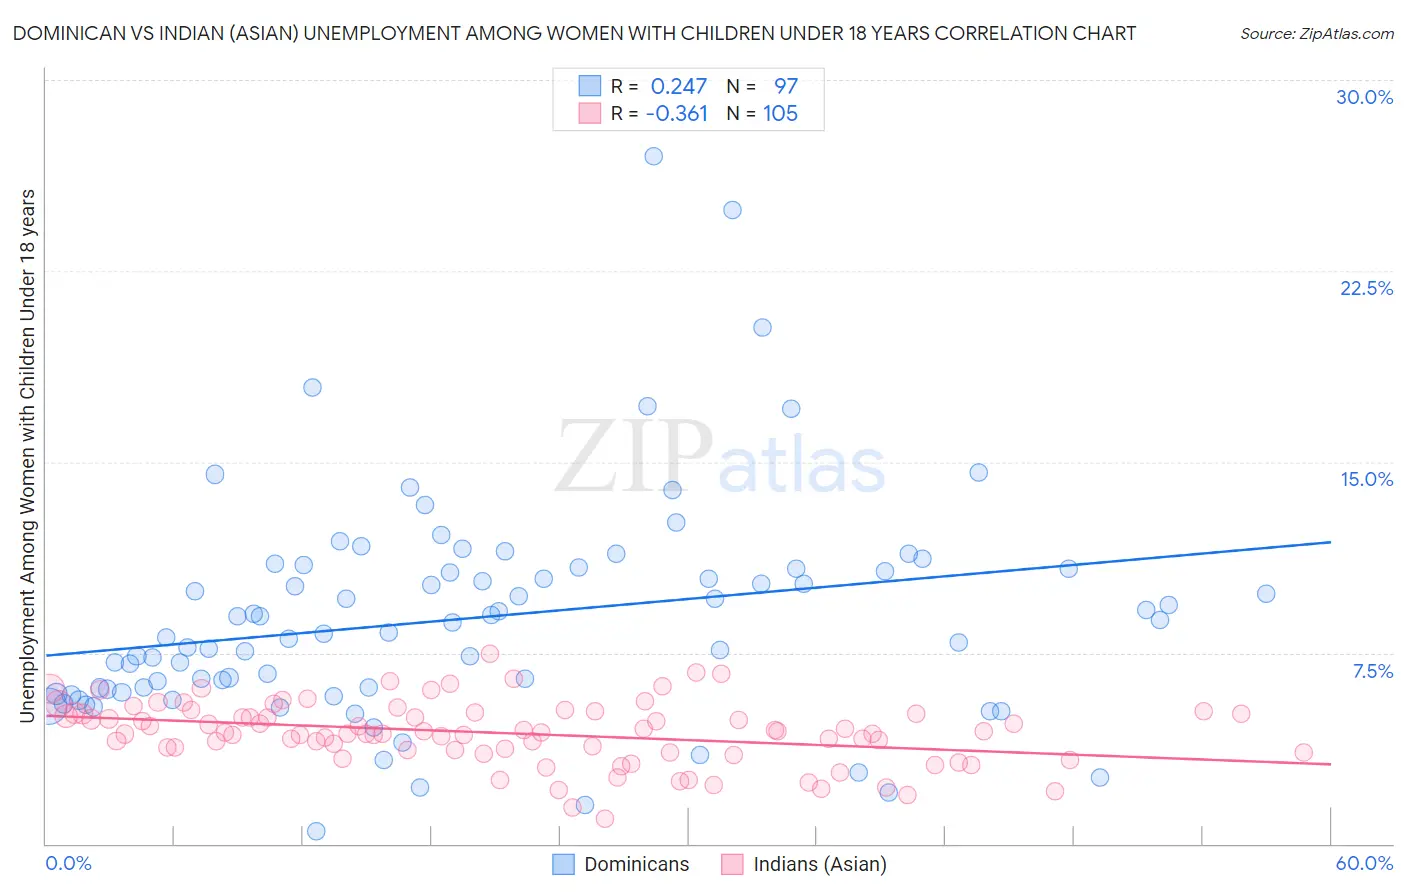
Dominican vs Indian (Asian) Unemployment Among Women with Children Under 18 years Correlation Chart
The statistical analysis conducted on geographies consisting of 343,360,704 people shows a weak positive correlation between the proportion of Dominicans and unemployment rate among women with children under the age of 18 in the United States with a correlation coefficient (R) of 0.247 and weighted average of 7.5%. Similarly, the statistical analysis conducted on geographies consisting of 466,994,640 people shows a mild negative correlation between the proportion of Indians (Asian) and unemployment rate among women with children under the age of 18 in the United States with a correlation coefficient (R) of -0.361 and weighted average of 4.9%, a difference of 52.0%.
Unemployment Among Women with Children Under 18 years Correlation Summary
| Measurement | Dominican | Indian (Asian) |
| Minimum | 0.50% | 1.0% |
| Maximum | 27.0% | 7.5% |
| Range | 26.5% | 6.5% |
| Mean | 8.9% | 4.3% |
| Median | 8.3% | 4.3% |
| Interquartile 25% (IQ1) | 6.0% | 3.6% |
| Interquartile 75% (IQ3) | 10.8% | 5.1% |
| Interquartile Range (IQR) | 4.8% | 1.5% |
| Standard Deviation (Sample) | 4.4% | 1.2% |
| Standard Deviation (Population) | 4.3% | 1.2% |
Similar Demographics by Unemployment Among Women with Children Under 18 years
Demographics Similar to Dominicans by Unemployment Among Women with Children Under 18 years
In terms of unemployment among women with children under 18 years, the demographic groups most similar to Dominicans are Immigrants from Dominican Republic (7.5%, a difference of 0.36%), Hopi (7.4%, a difference of 0.54%), Colville (7.4%, a difference of 1.1%), Black/African American (7.3%, a difference of 2.6%), and Native/Alaskan (7.2%, a difference of 3.0%).
| Demographics | Rating | Rank | Unemployment Among Women with Children Under 18 years |
| Immigrants | Dominica | 0.0 /100 | #325 | Tragic 7.0% |
| Chippewa | 0.0 /100 | #326 | Tragic 7.0% |
| Lumbee | 0.0 /100 | #327 | Tragic 7.1% |
| Natives/Alaskans | 0.0 /100 | #328 | Tragic 7.2% |
| Blacks/African Americans | 0.0 /100 | #329 | Tragic 7.3% |
| Colville | 0.0 /100 | #330 | Tragic 7.4% |
| Hopi | 0.0 /100 | #331 | Tragic 7.4% |
| Dominicans | 0.0 /100 | #332 | Tragic 7.5% |
| Immigrants | Dominican Republic | 0.0 /100 | #333 | Tragic 7.5% |
| Cheyenne | 0.0 /100 | #334 | Tragic 7.8% |
| Apache | 0.0 /100 | #335 | Tragic 7.9% |
| Sioux | 0.0 /100 | #336 | Tragic 7.9% |
| Yakama | 0.0 /100 | #337 | Tragic 8.1% |
| Immigrants | Yemen | 0.0 /100 | #338 | Tragic 8.2% |
| Navajo | 0.0 /100 | #339 | Tragic 8.2% |
Demographics Similar to Indians (Asian) by Unemployment Among Women with Children Under 18 years
In terms of unemployment among women with children under 18 years, the demographic groups most similar to Indians (Asian) are European (4.9%, a difference of 0.19%), Immigrants from China (4.9%, a difference of 0.20%), Belgian (4.9%, a difference of 0.30%), Chinese (4.9%, a difference of 0.30%), and Swiss (4.9%, a difference of 0.41%).
| Demographics | Rating | Rank | Unemployment Among Women with Children Under 18 years |
| Thais | 99.8 /100 | #15 | Exceptional 4.8% |
| Taiwanese | 99.8 /100 | #16 | Exceptional 4.8% |
| Immigrants | Singapore | 99.8 /100 | #17 | Exceptional 4.9% |
| Slovenes | 99.8 /100 | #18 | Exceptional 4.9% |
| Germans | 99.8 /100 | #19 | Exceptional 4.9% |
| Latvians | 99.7 /100 | #20 | Exceptional 4.9% |
| Europeans | 99.6 /100 | #21 | Exceptional 4.9% |
| Indians (Asian) | 99.6 /100 | #22 | Exceptional 4.9% |
| Immigrants | China | 99.6 /100 | #23 | Exceptional 4.9% |
| Belgians | 99.5 /100 | #24 | Exceptional 4.9% |
| Chinese | 99.5 /100 | #25 | Exceptional 4.9% |
| Swiss | 99.5 /100 | #26 | Exceptional 4.9% |
| Soviet Union | 99.5 /100 | #27 | Exceptional 4.9% |
| Immigrants | Eastern Asia | 99.5 /100 | #28 | Exceptional 4.9% |
| Finns | 99.4 /100 | #29 | Exceptional 4.9% |