Immigrants from Nicaragua vs Indian (Asian) Per Capita Income
COMPARE
Immigrants from Nicaragua
Indian (Asian)
Per Capita Income
Per Capita Income Comparison
Immigrants from Nicaragua
Indians (Asian)
$38,065
PER CAPITA INCOME
0.2/ 100
METRIC RATING
278th/ 347
METRIC RANK
$53,874
PER CAPITA INCOME
100.0/ 100
METRIC RATING
22nd/ 347
METRIC RANK
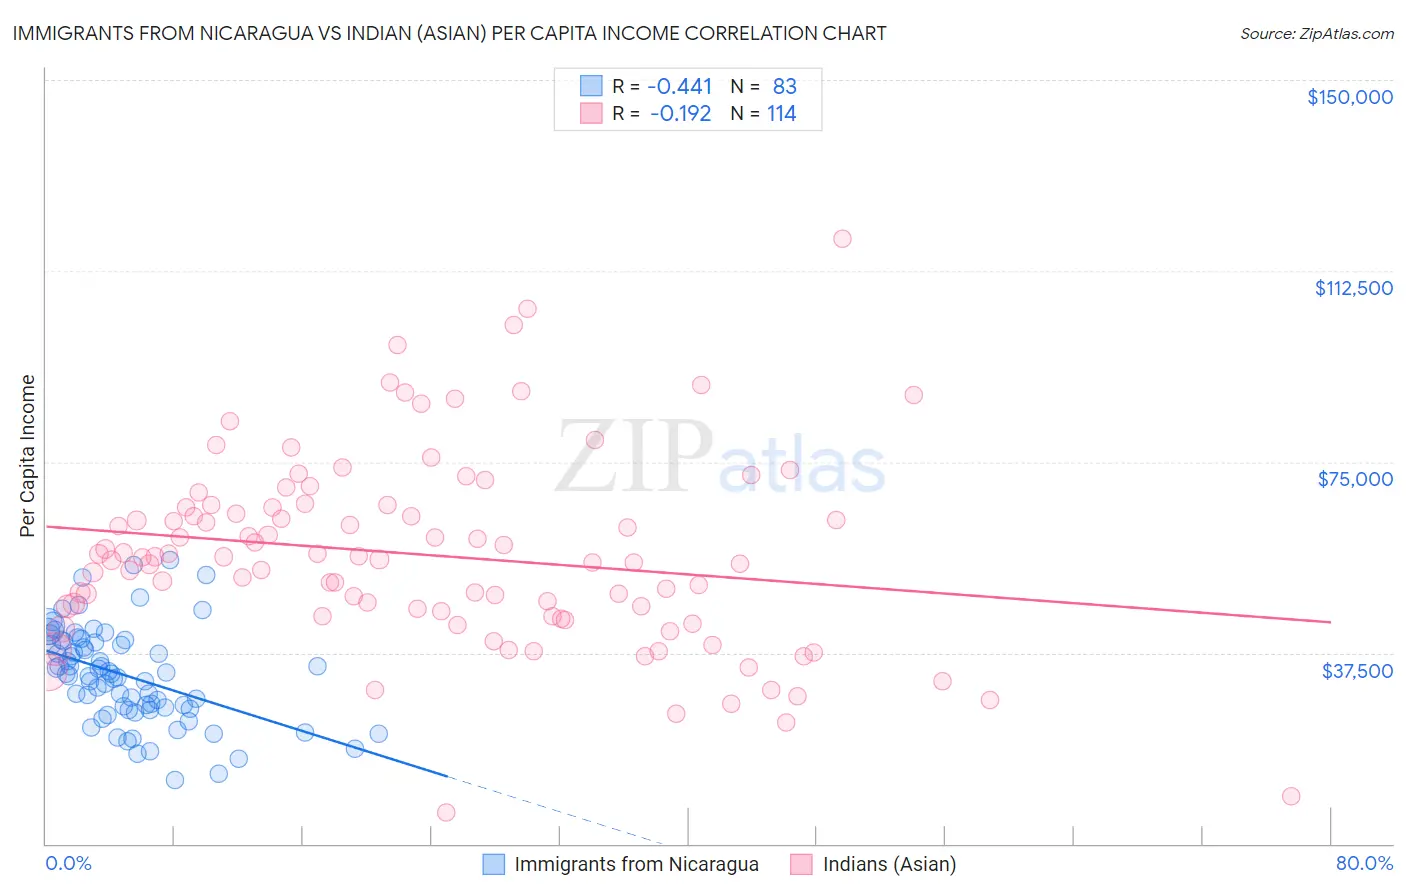
Immigrants from Nicaragua vs Indian (Asian) Per Capita Income Correlation Chart
The statistical analysis conducted on geographies consisting of 236,340,517 people shows a moderate negative correlation between the proportion of Immigrants from Nicaragua and per capita income in the United States with a correlation coefficient (R) of -0.441 and weighted average of $38,065. Similarly, the statistical analysis conducted on geographies consisting of 495,399,283 people shows a poor negative correlation between the proportion of Indians (Asian) and per capita income in the United States with a correlation coefficient (R) of -0.192 and weighted average of $53,874, a difference of 41.5%.
Per Capita Income Correlation Summary
| Measurement | Immigrants from Nicaragua | Indian (Asian) |
| Minimum | $12,549 | $6,086 |
| Maximum | $55,632 | $118,834 |
| Range | $43,083 | $112,748 |
| Mean | $33,018 | $56,707 |
| Median | $33,470 | $56,072 |
| Interquartile 25% (IQ1) | $26,578 | $44,771 |
| Interquartile 75% (IQ3) | $39,762 | $66,146 |
| Interquartile Range (IQR) | $13,184 | $21,374 |
| Standard Deviation (Sample) | $9,366 | $19,017 |
| Standard Deviation (Population) | $9,309 | $18,934 |
Similar Demographics by Per Capita Income
Demographics Similar to Immigrants from Nicaragua by Per Capita Income
In terms of per capita income, the demographic groups most similar to Immigrants from Nicaragua are Colville ($38,047, a difference of 0.050%), Potawatomi ($38,046, a difference of 0.050%), Comanche ($38,088, a difference of 0.060%), Hmong ($38,120, a difference of 0.15%), and Immigrants from Liberia ($38,165, a difference of 0.26%).
| Demographics | Rating | Rank | Per Capita Income |
| Central Americans | 0.3 /100 | #271 | Tragic $38,560 |
| Immigrants | Cabo Verde | 0.3 /100 | #272 | Tragic $38,540 |
| Nepalese | 0.3 /100 | #273 | Tragic $38,442 |
| Immigrants | El Salvador | 0.3 /100 | #274 | Tragic $38,394 |
| Immigrants | Liberia | 0.2 /100 | #275 | Tragic $38,165 |
| Hmong | 0.2 /100 | #276 | Tragic $38,120 |
| Comanche | 0.2 /100 | #277 | Tragic $38,088 |
| Immigrants | Nicaragua | 0.2 /100 | #278 | Tragic $38,065 |
| Colville | 0.2 /100 | #279 | Tragic $38,047 |
| Potawatomi | 0.2 /100 | #280 | Tragic $38,046 |
| Immigrants | Dominica | 0.2 /100 | #281 | Tragic $37,952 |
| Immigrants | Laos | 0.1 /100 | #282 | Tragic $37,857 |
| Pennsylvania Germans | 0.1 /100 | #283 | Tragic $37,842 |
| Africans | 0.1 /100 | #284 | Tragic $37,785 |
| Guatemalans | 0.1 /100 | #285 | Tragic $37,766 |
Demographics Similar to Indians (Asian) by Per Capita Income
In terms of per capita income, the demographic groups most similar to Indians (Asian) are Immigrants from Eastern Asia ($53,806, a difference of 0.13%), Immigrants from Denmark ($53,799, a difference of 0.14%), Immigrants from Northern Europe ($54,159, a difference of 0.53%), Soviet Union ($54,202, a difference of 0.61%), and Immigrants from China ($54,264, a difference of 0.72%).
| Demographics | Rating | Rank | Per Capita Income |
| Cypriots | 100.0 /100 | #15 | Exceptional $54,899 |
| Immigrants | Switzerland | 100.0 /100 | #16 | Exceptional $54,866 |
| Immigrants | France | 100.0 /100 | #17 | Exceptional $54,557 |
| Thais | 100.0 /100 | #18 | Exceptional $54,307 |
| Immigrants | China | 100.0 /100 | #19 | Exceptional $54,264 |
| Soviet Union | 100.0 /100 | #20 | Exceptional $54,202 |
| Immigrants | Northern Europe | 100.0 /100 | #21 | Exceptional $54,159 |
| Indians (Asian) | 100.0 /100 | #22 | Exceptional $53,874 |
| Immigrants | Eastern Asia | 100.0 /100 | #23 | Exceptional $53,806 |
| Immigrants | Denmark | 100.0 /100 | #24 | Exceptional $53,799 |
| Immigrants | Japan | 100.0 /100 | #25 | Exceptional $53,359 |
| Russians | 100.0 /100 | #26 | Exceptional $53,154 |
| Immigrants | South Central Asia | 100.0 /100 | #27 | Exceptional $52,660 |
| Latvians | 100.0 /100 | #28 | Exceptional $52,649 |
| Israelis | 100.0 /100 | #29 | Exceptional $52,596 |