Laotian vs Indian (Asian) Per Capita Income
COMPARE
Laotian
Indian (Asian)
Per Capita Income
Per Capita Income Comparison
Laotians
Indians (Asian)
$47,041
PER CAPITA INCOME
97.8/ 100
METRIC RATING
99th/ 347
METRIC RANK
$53,874
PER CAPITA INCOME
100.0/ 100
METRIC RATING
22nd/ 347
METRIC RANK
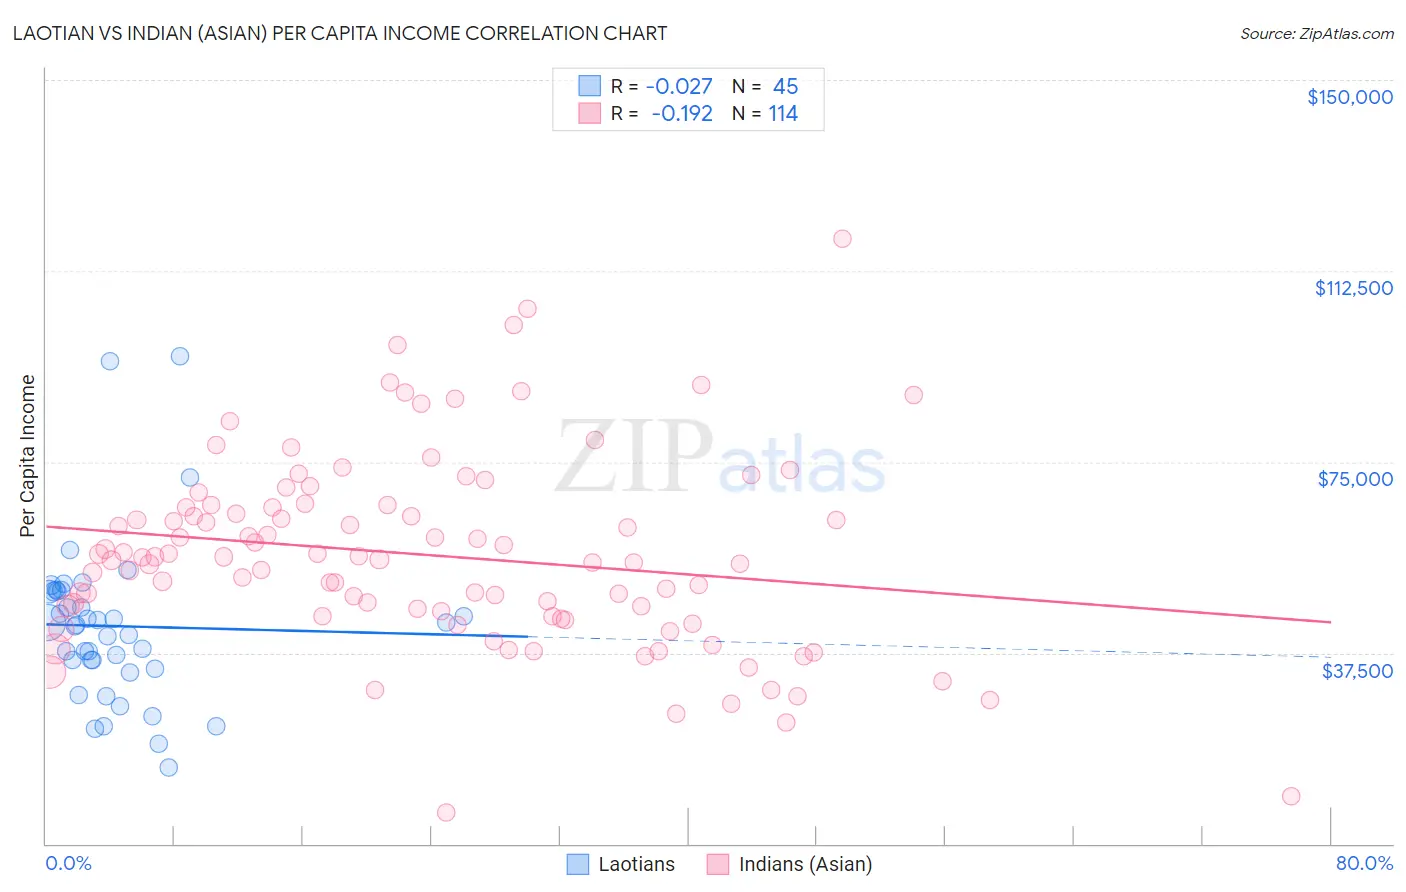
Laotian vs Indian (Asian) Per Capita Income Correlation Chart
The statistical analysis conducted on geographies consisting of 224,867,233 people shows no correlation between the proportion of Laotians and per capita income in the United States with a correlation coefficient (R) of -0.027 and weighted average of $47,041. Similarly, the statistical analysis conducted on geographies consisting of 495,399,283 people shows a poor negative correlation between the proportion of Indians (Asian) and per capita income in the United States with a correlation coefficient (R) of -0.192 and weighted average of $53,874, a difference of 14.5%.
Per Capita Income Correlation Summary
| Measurement | Laotian | Indian (Asian) |
| Minimum | $14,980 | $6,086 |
| Maximum | $95,805 | $118,834 |
| Range | $80,825 | $112,748 |
| Mean | $42,727 | $56,707 |
| Median | $43,043 | $56,072 |
| Interquartile 25% (IQ1) | $35,205 | $44,771 |
| Interquartile 75% (IQ3) | $49,592 | $66,146 |
| Interquartile Range (IQR) | $14,387 | $21,374 |
| Standard Deviation (Sample) | $15,836 | $19,017 |
| Standard Deviation (Population) | $15,659 | $18,934 |
Similar Demographics by Per Capita Income
Demographics Similar to Laotians by Per Capita Income
In terms of per capita income, the demographic groups most similar to Laotians are Immigrants from Pakistan ($47,084, a difference of 0.090%), Immigrants from Lebanon ($46,938, a difference of 0.22%), Immigrants from Uzbekistan ($46,929, a difference of 0.24%), Immigrants from Western Asia ($46,876, a difference of 0.35%), and Syrian ($46,837, a difference of 0.43%).
| Demographics | Rating | Rank | Per Capita Income |
| Immigrants | Moldova | 98.7 /100 | #92 | Exceptional $47,489 |
| Immigrants | Zimbabwe | 98.5 /100 | #93 | Exceptional $47,394 |
| Albanians | 98.5 /100 | #94 | Exceptional $47,379 |
| Immigrants | Egypt | 98.5 /100 | #95 | Exceptional $47,361 |
| Alsatians | 98.3 /100 | #96 | Exceptional $47,284 |
| Carpatho Rusyns | 98.2 /100 | #97 | Exceptional $47,248 |
| Immigrants | Pakistan | 97.9 /100 | #98 | Exceptional $47,084 |
| Laotians | 97.8 /100 | #99 | Exceptional $47,041 |
| Immigrants | Lebanon | 97.5 /100 | #100 | Exceptional $46,938 |
| Immigrants | Uzbekistan | 97.5 /100 | #101 | Exceptional $46,929 |
| Immigrants | Western Asia | 97.4 /100 | #102 | Exceptional $46,876 |
| Syrians | 97.2 /100 | #103 | Exceptional $46,837 |
| Brazilians | 96.8 /100 | #104 | Exceptional $46,700 |
| British | 96.3 /100 | #105 | Exceptional $46,571 |
| Ethiopians | 96.3 /100 | #106 | Exceptional $46,569 |
Demographics Similar to Indians (Asian) by Per Capita Income
In terms of per capita income, the demographic groups most similar to Indians (Asian) are Immigrants from Eastern Asia ($53,806, a difference of 0.13%), Immigrants from Denmark ($53,799, a difference of 0.14%), Immigrants from Northern Europe ($54,159, a difference of 0.53%), Soviet Union ($54,202, a difference of 0.61%), and Immigrants from China ($54,264, a difference of 0.72%).
| Demographics | Rating | Rank | Per Capita Income |
| Cypriots | 100.0 /100 | #15 | Exceptional $54,899 |
| Immigrants | Switzerland | 100.0 /100 | #16 | Exceptional $54,866 |
| Immigrants | France | 100.0 /100 | #17 | Exceptional $54,557 |
| Thais | 100.0 /100 | #18 | Exceptional $54,307 |
| Immigrants | China | 100.0 /100 | #19 | Exceptional $54,264 |
| Soviet Union | 100.0 /100 | #20 | Exceptional $54,202 |
| Immigrants | Northern Europe | 100.0 /100 | #21 | Exceptional $54,159 |
| Indians (Asian) | 100.0 /100 | #22 | Exceptional $53,874 |
| Immigrants | Eastern Asia | 100.0 /100 | #23 | Exceptional $53,806 |
| Immigrants | Denmark | 100.0 /100 | #24 | Exceptional $53,799 |
| Immigrants | Japan | 100.0 /100 | #25 | Exceptional $53,359 |
| Russians | 100.0 /100 | #26 | Exceptional $53,154 |
| Immigrants | South Central Asia | 100.0 /100 | #27 | Exceptional $52,660 |
| Latvians | 100.0 /100 | #28 | Exceptional $52,649 |
| Israelis | 100.0 /100 | #29 | Exceptional $52,596 |