Dominican vs Immigrants from Mexico Per Capita Income
COMPARE
Dominican
Immigrants from Mexico
Per Capita Income
Per Capita Income Comparison
Dominicans
Immigrants from Mexico
$37,697
PER CAPITA INCOME
0.1/ 100
METRIC RATING
287th/ 347
METRIC RANK
$33,931
PER CAPITA INCOME
0.0/ 100
METRIC RATING
331st/ 347
METRIC RANK
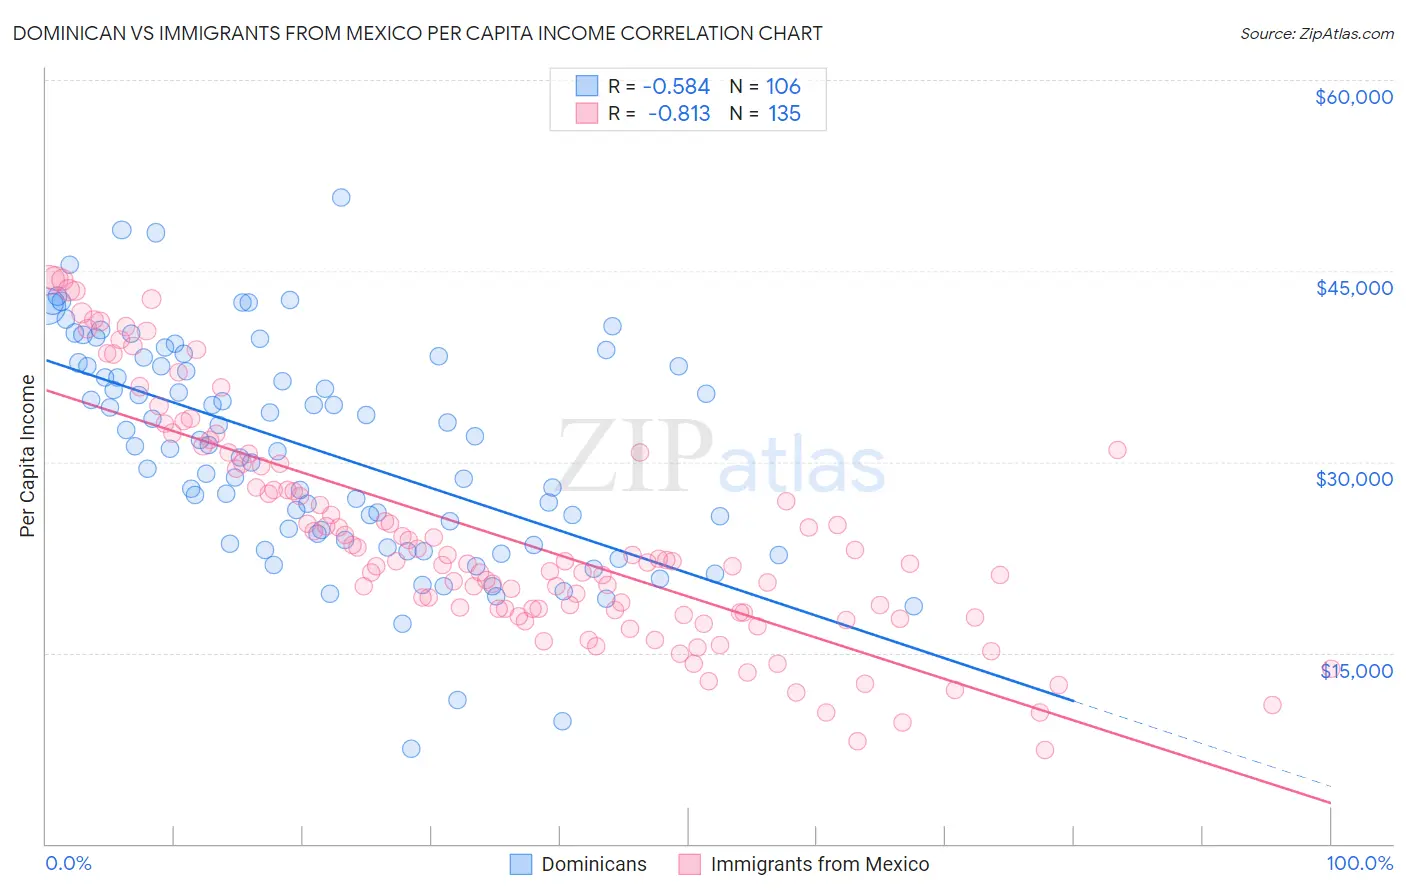
Dominican vs Immigrants from Mexico Per Capita Income Correlation Chart
The statistical analysis conducted on geographies consisting of 355,170,092 people shows a substantial negative correlation between the proportion of Dominicans and per capita income in the United States with a correlation coefficient (R) of -0.584 and weighted average of $37,697. Similarly, the statistical analysis conducted on geographies consisting of 513,776,249 people shows a very strong negative correlation between the proportion of Immigrants from Mexico and per capita income in the United States with a correlation coefficient (R) of -0.813 and weighted average of $33,931, a difference of 11.1%.
Per Capita Income Correlation Summary
| Measurement | Dominican | Immigrants from Mexico |
| Minimum | $7,474 | $7,365 |
| Maximum | $50,766 | $44,424 |
| Range | $43,292 | $37,059 |
| Mean | $30,940 | $24,192 |
| Median | $31,292 | $22,163 |
| Interquartile 25% (IQ1) | $23,892 | $18,195 |
| Interquartile 75% (IQ3) | $37,544 | $29,815 |
| Interquartile Range (IQR) | $13,652 | $11,620 |
| Standard Deviation (Sample) | $8,599 | $8,892 |
| Standard Deviation (Population) | $8,559 | $8,859 |
Similar Demographics by Per Capita Income
Demographics Similar to Dominicans by Per Capita Income
In terms of per capita income, the demographic groups most similar to Dominicans are Blackfeet ($37,695, a difference of 0.0%), Central American Indian ($37,699, a difference of 0.010%), Guatemalan ($37,766, a difference of 0.19%), African ($37,785, a difference of 0.24%), and U.S. Virgin Islander ($37,589, a difference of 0.29%).
| Demographics | Rating | Rank | Per Capita Income |
| Potawatomi | 0.2 /100 | #280 | Tragic $38,046 |
| Immigrants | Dominica | 0.2 /100 | #281 | Tragic $37,952 |
| Immigrants | Laos | 0.1 /100 | #282 | Tragic $37,857 |
| Pennsylvania Germans | 0.1 /100 | #283 | Tragic $37,842 |
| Africans | 0.1 /100 | #284 | Tragic $37,785 |
| Guatemalans | 0.1 /100 | #285 | Tragic $37,766 |
| Central American Indians | 0.1 /100 | #286 | Tragic $37,699 |
| Dominicans | 0.1 /100 | #287 | Tragic $37,697 |
| Blackfeet | 0.1 /100 | #288 | Tragic $37,695 |
| U.S. Virgin Islanders | 0.1 /100 | #289 | Tragic $37,589 |
| Immigrants | Guatemala | 0.1 /100 | #290 | Tragic $37,550 |
| Cajuns | 0.1 /100 | #291 | Tragic $37,527 |
| Immigrants | Micronesia | 0.1 /100 | #292 | Tragic $37,464 |
| Mexican American Indians | 0.1 /100 | #293 | Tragic $37,407 |
| Cubans | 0.1 /100 | #294 | Tragic $37,383 |
Demographics Similar to Immigrants from Mexico by Per Capita Income
In terms of per capita income, the demographic groups most similar to Immigrants from Mexico are Sioux ($33,921, a difference of 0.030%), Immigrants from Yemen ($33,696, a difference of 0.70%), Spanish American Indian ($34,195, a difference of 0.78%), Mexican ($34,559, a difference of 1.8%), and Menominee ($34,578, a difference of 1.9%).
| Demographics | Rating | Rank | Per Capita Income |
| Kiowa | 0.0 /100 | #324 | Tragic $35,102 |
| Immigrants | Central America | 0.0 /100 | #325 | Tragic $34,974 |
| Immigrants | Cuba | 0.0 /100 | #326 | Tragic $34,910 |
| Apache | 0.0 /100 | #327 | Tragic $34,886 |
| Menominee | 0.0 /100 | #328 | Tragic $34,578 |
| Mexicans | 0.0 /100 | #329 | Tragic $34,559 |
| Spanish American Indians | 0.0 /100 | #330 | Tragic $34,195 |
| Immigrants | Mexico | 0.0 /100 | #331 | Tragic $33,931 |
| Sioux | 0.0 /100 | #332 | Tragic $33,921 |
| Immigrants | Yemen | 0.0 /100 | #333 | Tragic $33,696 |
| Natives/Alaskans | 0.0 /100 | #334 | Tragic $33,279 |
| Yuman | 0.0 /100 | #335 | Tragic $33,236 |
| Yakama | 0.0 /100 | #336 | Tragic $33,009 |
| Houma | 0.0 /100 | #337 | Tragic $32,996 |
| Arapaho | 0.0 /100 | #338 | Tragic $32,345 |