Romanian vs Immigrants from China Median Earnings
COMPARE
Romanian
Immigrants from China
Median Earnings
Median Earnings Comparison
Romanians
Immigrants from China
$50,244
MEDIAN EARNINGS
99.5/ 100
METRIC RATING
83rd/ 347
METRIC RANK
$56,638
MEDIAN EARNINGS
100.0/ 100
METRIC RATING
13th/ 347
METRIC RANK
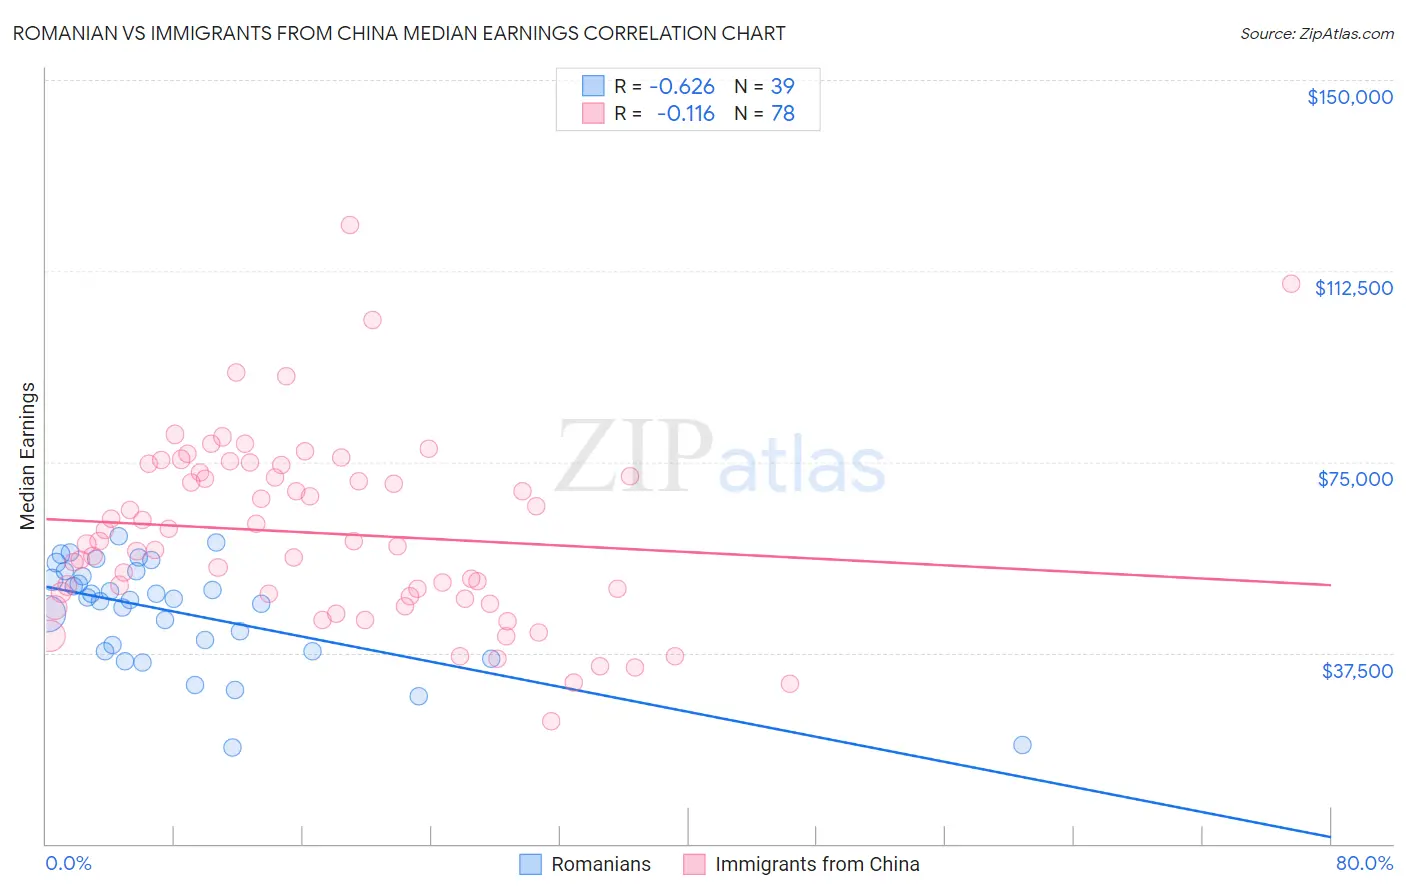
Romanian vs Immigrants from China Median Earnings Correlation Chart
The statistical analysis conducted on geographies consisting of 377,906,078 people shows a significant negative correlation between the proportion of Romanians and median earnings in the United States with a correlation coefficient (R) of -0.626 and weighted average of $50,244. Similarly, the statistical analysis conducted on geographies consisting of 457,063,643 people shows a poor negative correlation between the proportion of Immigrants from China and median earnings in the United States with a correlation coefficient (R) of -0.116 and weighted average of $56,638, a difference of 12.7%.
Median Earnings Correlation Summary
| Measurement | Romanian | Immigrants from China |
| Minimum | $18,814 | $23,942 |
| Maximum | $60,367 | $121,459 |
| Range | $41,553 | $97,517 |
| Mean | $45,500 | $60,963 |
| Median | $48,068 | $59,099 |
| Interquartile 25% (IQ1) | $37,750 | $48,648 |
| Interquartile 75% (IQ3) | $53,505 | $73,028 |
| Interquartile Range (IQR) | $15,755 | $24,380 |
| Standard Deviation (Sample) | $10,336 | $18,079 |
| Standard Deviation (Population) | $10,203 | $17,962 |
Similar Demographics by Median Earnings
Demographics Similar to Romanians by Median Earnings
In terms of median earnings, the demographic groups most similar to Romanians are Immigrants from Hungary ($50,227, a difference of 0.030%), Immigrants from Kazakhstan ($50,225, a difference of 0.040%), Immigrants from Moldova ($50,274, a difference of 0.060%), Immigrants from Southern Europe ($50,280, a difference of 0.070%), and Immigrants from Canada ($50,192, a difference of 0.10%).
| Demographics | Rating | Rank | Median Earnings |
| Immigrants | Italy | 99.7 /100 | #76 | Exceptional $50,581 |
| Immigrants | Western Europe | 99.7 /100 | #77 | Exceptional $50,549 |
| Argentineans | 99.6 /100 | #78 | Exceptional $50,399 |
| Laotians | 99.6 /100 | #79 | Exceptional $50,343 |
| Ukrainians | 99.6 /100 | #80 | Exceptional $50,320 |
| Immigrants | Southern Europe | 99.6 /100 | #81 | Exceptional $50,280 |
| Immigrants | Moldova | 99.5 /100 | #82 | Exceptional $50,274 |
| Romanians | 99.5 /100 | #83 | Exceptional $50,244 |
| Immigrants | Hungary | 99.5 /100 | #84 | Exceptional $50,227 |
| Immigrants | Kazakhstan | 99.5 /100 | #85 | Exceptional $50,225 |
| Immigrants | Canada | 99.5 /100 | #86 | Exceptional $50,192 |
| Immigrants | Uzbekistan | 99.5 /100 | #87 | Exceptional $50,151 |
| Albanians | 99.4 /100 | #88 | Exceptional $50,116 |
| Immigrants | North America | 99.4 /100 | #89 | Exceptional $50,108 |
| Italians | 99.3 /100 | #90 | Exceptional $49,915 |
Demographics Similar to Immigrants from China by Median Earnings
In terms of median earnings, the demographic groups most similar to Immigrants from China are Immigrants from Ireland ($56,854, a difference of 0.38%), Immigrants from Australia ($56,305, a difference of 0.59%), Indian (Asian) ($56,253, a difference of 0.68%), Immigrants from Israel ($57,034, a difference of 0.70%), and Immigrants from Eastern Asia ($56,183, a difference of 0.81%).
| Demographics | Rating | Rank | Median Earnings |
| Immigrants | Singapore | 100.0 /100 | #6 | Exceptional $59,038 |
| Iranians | 100.0 /100 | #7 | Exceptional $58,474 |
| Immigrants | Iran | 100.0 /100 | #8 | Exceptional $57,612 |
| Okinawans | 100.0 /100 | #9 | Exceptional $57,550 |
| Immigrants | South Central Asia | 100.0 /100 | #10 | Exceptional $57,114 |
| Immigrants | Israel | 100.0 /100 | #11 | Exceptional $57,034 |
| Immigrants | Ireland | 100.0 /100 | #12 | Exceptional $56,854 |
| Immigrants | China | 100.0 /100 | #13 | Exceptional $56,638 |
| Immigrants | Australia | 100.0 /100 | #14 | Exceptional $56,305 |
| Indians (Asian) | 100.0 /100 | #15 | Exceptional $56,253 |
| Immigrants | Eastern Asia | 100.0 /100 | #16 | Exceptional $56,183 |
| Eastern Europeans | 100.0 /100 | #17 | Exceptional $55,084 |
| Immigrants | Japan | 100.0 /100 | #18 | Exceptional $54,938 |
| Immigrants | Belgium | 100.0 /100 | #19 | Exceptional $54,679 |
| Cypriots | 100.0 /100 | #20 | Exceptional $54,589 |