Inupiat vs Immigrants from China Median Earnings
COMPARE
Inupiat
Immigrants from China
Median Earnings
Median Earnings Comparison
Inupiat
Immigrants from China
$43,000
MEDIAN EARNINGS
0.8/ 100
METRIC RATING
263rd/ 347
METRIC RANK
$56,638
MEDIAN EARNINGS
100.0/ 100
METRIC RATING
13th/ 347
METRIC RANK
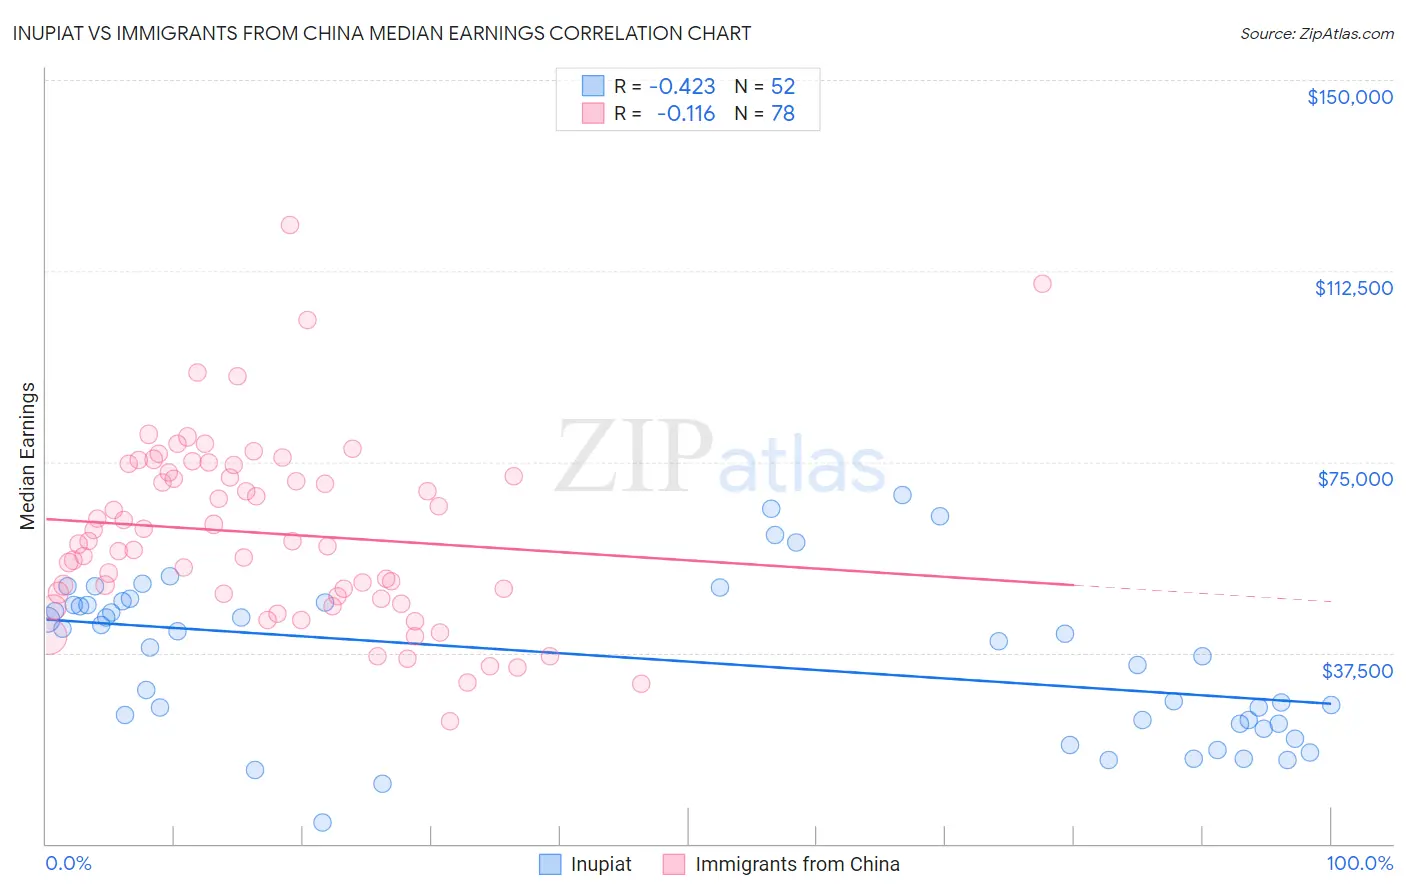
Inupiat vs Immigrants from China Median Earnings Correlation Chart
The statistical analysis conducted on geographies consisting of 96,339,660 people shows a moderate negative correlation between the proportion of Inupiat and median earnings in the United States with a correlation coefficient (R) of -0.423 and weighted average of $43,000. Similarly, the statistical analysis conducted on geographies consisting of 457,063,643 people shows a poor negative correlation between the proportion of Immigrants from China and median earnings in the United States with a correlation coefficient (R) of -0.116 and weighted average of $56,638, a difference of 31.7%.
Median Earnings Correlation Summary
| Measurement | Inupiat | Immigrants from China |
| Minimum | $4,192 | $23,942 |
| Maximum | $68,590 | $121,459 |
| Range | $64,398 | $97,517 |
| Mean | $36,209 | $60,963 |
| Median | $39,208 | $59,099 |
| Interquartile 25% (IQ1) | $23,611 | $48,648 |
| Interquartile 75% (IQ3) | $47,170 | $73,028 |
| Interquartile Range (IQR) | $23,559 | $24,380 |
| Standard Deviation (Sample) | $15,551 | $18,079 |
| Standard Deviation (Population) | $15,401 | $17,962 |
Similar Demographics by Median Earnings
Demographics Similar to Inupiat by Median Earnings
In terms of median earnings, the demographic groups most similar to Inupiat are Immigrants from Jamaica ($43,026, a difference of 0.060%), Nicaraguan ($43,026, a difference of 0.060%), Immigrants from Liberia ($42,923, a difference of 0.18%), Salvadoran ($42,912, a difference of 0.20%), and Immigrants from Somalia ($43,100, a difference of 0.23%).
| Demographics | Rating | Rank | Median Earnings |
| Alaskan Athabascans | 1.4 /100 | #256 | Tragic $43,393 |
| Jamaicans | 1.3 /100 | #257 | Tragic $43,343 |
| French American Indians | 1.3 /100 | #258 | Tragic $43,333 |
| German Russians | 1.1 /100 | #259 | Tragic $43,200 |
| Immigrants | Somalia | 0.9 /100 | #260 | Tragic $43,100 |
| Immigrants | Jamaica | 0.8 /100 | #261 | Tragic $43,026 |
| Nicaraguans | 0.8 /100 | #262 | Tragic $43,026 |
| Inupiat | 0.8 /100 | #263 | Tragic $43,000 |
| Immigrants | Liberia | 0.7 /100 | #264 | Tragic $42,923 |
| Salvadorans | 0.7 /100 | #265 | Tragic $42,912 |
| Immigrants | Laos | 0.7 /100 | #266 | Tragic $42,884 |
| Cree | 0.6 /100 | #267 | Tragic $42,777 |
| Americans | 0.6 /100 | #268 | Tragic $42,742 |
| Belizeans | 0.5 /100 | #269 | Tragic $42,702 |
| Osage | 0.5 /100 | #270 | Tragic $42,651 |
Demographics Similar to Immigrants from China by Median Earnings
In terms of median earnings, the demographic groups most similar to Immigrants from China are Immigrants from Ireland ($56,854, a difference of 0.38%), Immigrants from Australia ($56,305, a difference of 0.59%), Indian (Asian) ($56,253, a difference of 0.68%), Immigrants from Israel ($57,034, a difference of 0.70%), and Immigrants from Eastern Asia ($56,183, a difference of 0.81%).
| Demographics | Rating | Rank | Median Earnings |
| Immigrants | Singapore | 100.0 /100 | #6 | Exceptional $59,038 |
| Iranians | 100.0 /100 | #7 | Exceptional $58,474 |
| Immigrants | Iran | 100.0 /100 | #8 | Exceptional $57,612 |
| Okinawans | 100.0 /100 | #9 | Exceptional $57,550 |
| Immigrants | South Central Asia | 100.0 /100 | #10 | Exceptional $57,114 |
| Immigrants | Israel | 100.0 /100 | #11 | Exceptional $57,034 |
| Immigrants | Ireland | 100.0 /100 | #12 | Exceptional $56,854 |
| Immigrants | China | 100.0 /100 | #13 | Exceptional $56,638 |
| Immigrants | Australia | 100.0 /100 | #14 | Exceptional $56,305 |
| Indians (Asian) | 100.0 /100 | #15 | Exceptional $56,253 |
| Immigrants | Eastern Asia | 100.0 /100 | #16 | Exceptional $56,183 |
| Eastern Europeans | 100.0 /100 | #17 | Exceptional $55,084 |
| Immigrants | Japan | 100.0 /100 | #18 | Exceptional $54,938 |
| Immigrants | Belgium | 100.0 /100 | #19 | Exceptional $54,679 |
| Cypriots | 100.0 /100 | #20 | Exceptional $54,589 |