Iroquois vs Immigrants from China Median Earnings
COMPARE
Iroquois
Immigrants from China
Median Earnings
Median Earnings Comparison
Iroquois
Immigrants from China
$42,430
MEDIAN EARNINGS
0.4/ 100
METRIC RATING
272nd/ 347
METRIC RANK
$56,638
MEDIAN EARNINGS
100.0/ 100
METRIC RATING
13th/ 347
METRIC RANK
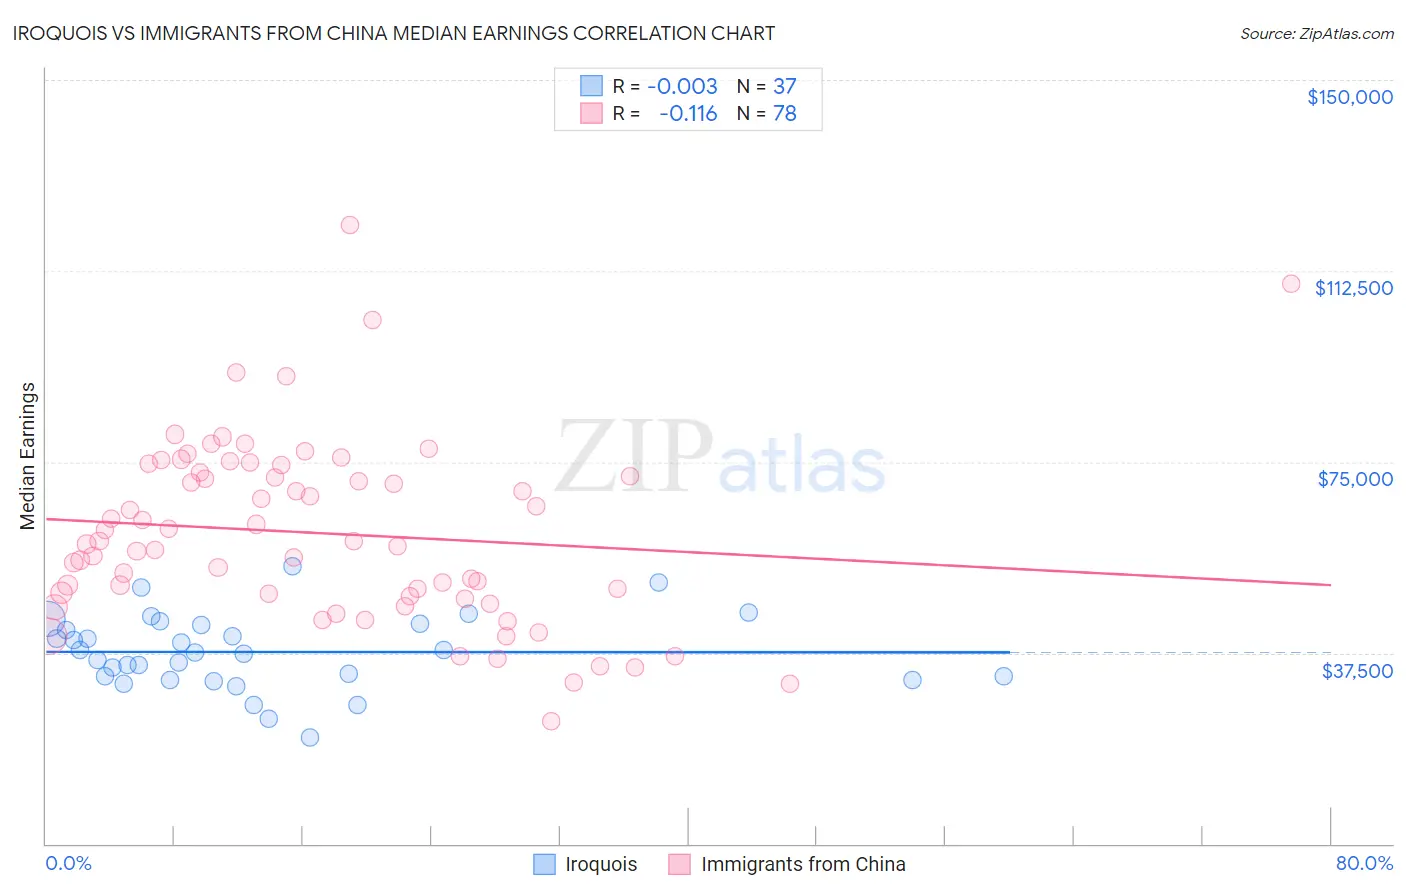
Iroquois vs Immigrants from China Median Earnings Correlation Chart
The statistical analysis conducted on geographies consisting of 207,284,609 people shows no correlation between the proportion of Iroquois and median earnings in the United States with a correlation coefficient (R) of -0.003 and weighted average of $42,430. Similarly, the statistical analysis conducted on geographies consisting of 457,063,643 people shows a poor negative correlation between the proportion of Immigrants from China and median earnings in the United States with a correlation coefficient (R) of -0.116 and weighted average of $56,638, a difference of 33.5%.
Median Earnings Correlation Summary
| Measurement | Iroquois | Immigrants from China |
| Minimum | $20,893 | $23,942 |
| Maximum | $54,543 | $121,459 |
| Range | $33,650 | $97,517 |
| Mean | $37,652 | $60,963 |
| Median | $37,608 | $59,099 |
| Interquartile 25% (IQ1) | $32,548 | $48,648 |
| Interquartile 75% (IQ3) | $43,095 | $73,028 |
| Interquartile Range (IQR) | $10,547 | $24,380 |
| Standard Deviation (Sample) | $7,302 | $18,079 |
| Standard Deviation (Population) | $7,203 | $17,962 |
Similar Demographics by Median Earnings
Demographics Similar to Iroquois by Median Earnings
In terms of median earnings, the demographic groups most similar to Iroquois are Immigrants from Dominica ($42,420, a difference of 0.030%), Immigrants from El Salvador ($42,413, a difference of 0.040%), Immigrants from Belize ($42,339, a difference of 0.22%), Spanish American ($42,316, a difference of 0.27%), and Central American ($42,280, a difference of 0.36%).
| Demographics | Rating | Rank | Median Earnings |
| Salvadorans | 0.7 /100 | #265 | Tragic $42,912 |
| Immigrants | Laos | 0.7 /100 | #266 | Tragic $42,884 |
| Cree | 0.6 /100 | #267 | Tragic $42,777 |
| Americans | 0.6 /100 | #268 | Tragic $42,742 |
| Belizeans | 0.5 /100 | #269 | Tragic $42,702 |
| Osage | 0.5 /100 | #270 | Tragic $42,651 |
| Pennsylvania Germans | 0.5 /100 | #271 | Tragic $42,615 |
| Iroquois | 0.4 /100 | #272 | Tragic $42,430 |
| Immigrants | Dominica | 0.4 /100 | #273 | Tragic $42,420 |
| Immigrants | El Salvador | 0.4 /100 | #274 | Tragic $42,413 |
| Immigrants | Belize | 0.3 /100 | #275 | Tragic $42,339 |
| Spanish Americans | 0.3 /100 | #276 | Tragic $42,316 |
| Central Americans | 0.3 /100 | #277 | Tragic $42,280 |
| Cajuns | 0.3 /100 | #278 | Tragic $42,189 |
| Colville | 0.2 /100 | #279 | Tragic $42,151 |
Demographics Similar to Immigrants from China by Median Earnings
In terms of median earnings, the demographic groups most similar to Immigrants from China are Immigrants from Ireland ($56,854, a difference of 0.38%), Immigrants from Australia ($56,305, a difference of 0.59%), Indian (Asian) ($56,253, a difference of 0.68%), Immigrants from Israel ($57,034, a difference of 0.70%), and Immigrants from Eastern Asia ($56,183, a difference of 0.81%).
| Demographics | Rating | Rank | Median Earnings |
| Immigrants | Singapore | 100.0 /100 | #6 | Exceptional $59,038 |
| Iranians | 100.0 /100 | #7 | Exceptional $58,474 |
| Immigrants | Iran | 100.0 /100 | #8 | Exceptional $57,612 |
| Okinawans | 100.0 /100 | #9 | Exceptional $57,550 |
| Immigrants | South Central Asia | 100.0 /100 | #10 | Exceptional $57,114 |
| Immigrants | Israel | 100.0 /100 | #11 | Exceptional $57,034 |
| Immigrants | Ireland | 100.0 /100 | #12 | Exceptional $56,854 |
| Immigrants | China | 100.0 /100 | #13 | Exceptional $56,638 |
| Immigrants | Australia | 100.0 /100 | #14 | Exceptional $56,305 |
| Indians (Asian) | 100.0 /100 | #15 | Exceptional $56,253 |
| Immigrants | Eastern Asia | 100.0 /100 | #16 | Exceptional $56,183 |
| Eastern Europeans | 100.0 /100 | #17 | Exceptional $55,084 |
| Immigrants | Japan | 100.0 /100 | #18 | Exceptional $54,938 |
| Immigrants | Belgium | 100.0 /100 | #19 | Exceptional $54,679 |
| Cypriots | 100.0 /100 | #20 | Exceptional $54,589 |