Crow vs Immigrants from China Median Earnings
COMPARE
Crow
Immigrants from China
Median Earnings
Median Earnings Comparison
Crow
Immigrants from China
$38,707
MEDIAN EARNINGS
0.0/ 100
METRIC RATING
336th/ 347
METRIC RANK
$56,638
MEDIAN EARNINGS
100.0/ 100
METRIC RATING
13th/ 347
METRIC RANK
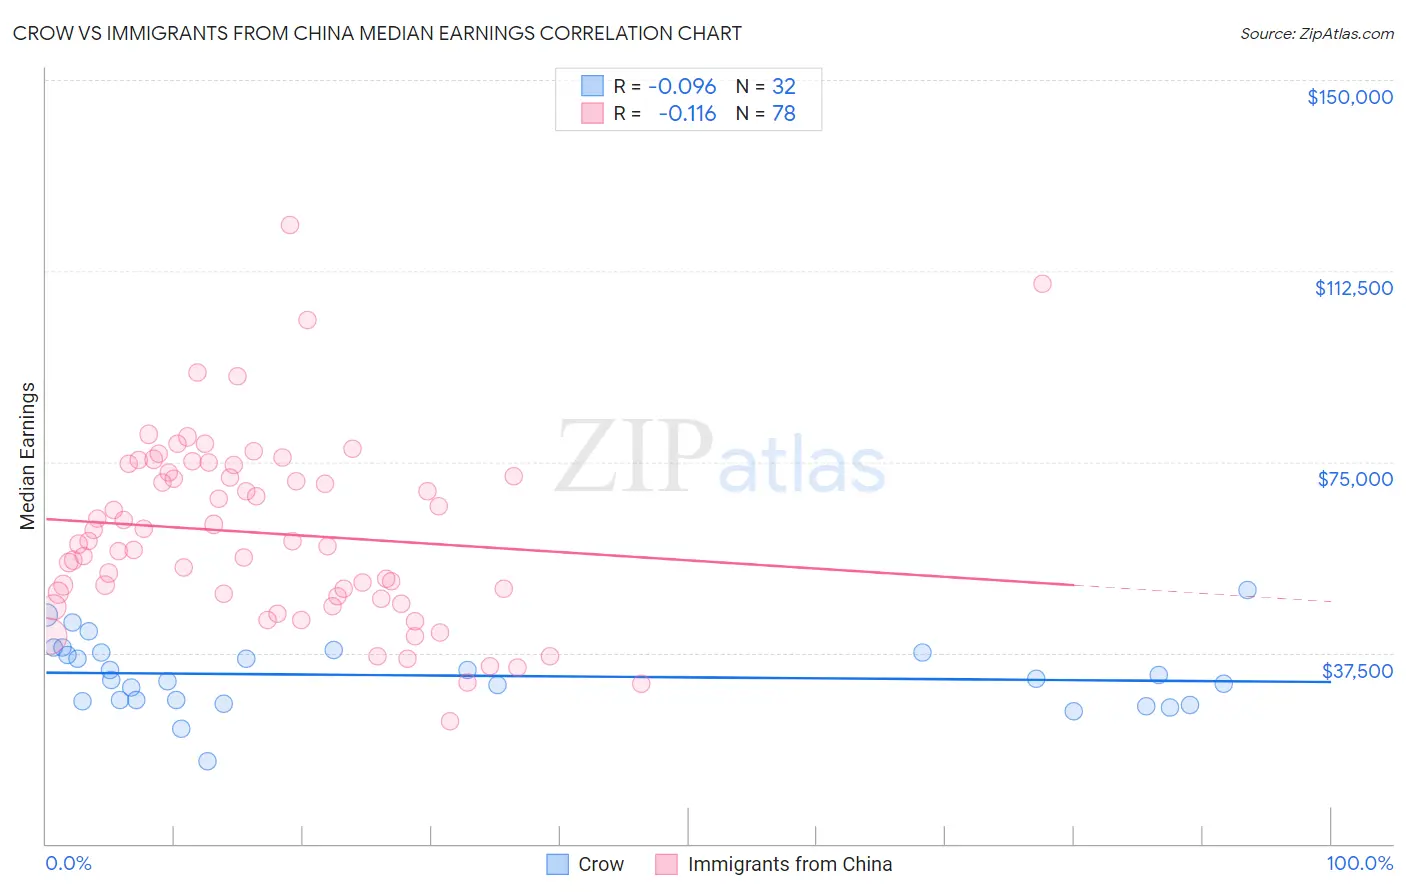
Crow vs Immigrants from China Median Earnings Correlation Chart
The statistical analysis conducted on geographies consisting of 59,204,148 people shows a slight negative correlation between the proportion of Crow and median earnings in the United States with a correlation coefficient (R) of -0.096 and weighted average of $38,707. Similarly, the statistical analysis conducted on geographies consisting of 457,063,643 people shows a poor negative correlation between the proportion of Immigrants from China and median earnings in the United States with a correlation coefficient (R) of -0.116 and weighted average of $56,638, a difference of 46.3%.
Median Earnings Correlation Summary
| Measurement | Crow | Immigrants from China |
| Minimum | $16,094 | $23,942 |
| Maximum | $49,926 | $121,459 |
| Range | $33,832 | $97,517 |
| Mean | $33,045 | $60,963 |
| Median | $32,361 | $59,099 |
| Interquartile 25% (IQ1) | $28,093 | $48,648 |
| Interquartile 75% (IQ3) | $37,549 | $73,028 |
| Interquartile Range (IQR) | $9,456 | $24,380 |
| Standard Deviation (Sample) | $6,875 | $18,079 |
| Standard Deviation (Population) | $6,767 | $17,962 |
Similar Demographics by Median Earnings
Demographics Similar to Crow by Median Earnings
In terms of median earnings, the demographic groups most similar to Crow are Native/Alaskan ($38,896, a difference of 0.49%), Spanish American Indian ($38,907, a difference of 0.52%), Houma ($38,949, a difference of 0.62%), Immigrants from Cuba ($38,426, a difference of 0.73%), and Yakama ($39,107, a difference of 1.0%).
| Demographics | Rating | Rank | Median Earnings |
| Kiowa | 0.0 /100 | #329 | Tragic $39,232 |
| Immigrants | Congo | 0.0 /100 | #330 | Tragic $39,169 |
| Immigrants | Mexico | 0.0 /100 | #331 | Tragic $39,114 |
| Yakama | 0.0 /100 | #332 | Tragic $39,107 |
| Houma | 0.0 /100 | #333 | Tragic $38,949 |
| Spanish American Indians | 0.0 /100 | #334 | Tragic $38,907 |
| Natives/Alaskans | 0.0 /100 | #335 | Tragic $38,896 |
| Crow | 0.0 /100 | #336 | Tragic $38,707 |
| Immigrants | Cuba | 0.0 /100 | #337 | Tragic $38,426 |
| Pima | 0.0 /100 | #338 | Tragic $38,285 |
| Menominee | 0.0 /100 | #339 | Tragic $37,884 |
| Navajo | 0.0 /100 | #340 | Tragic $36,999 |
| Lumbee | 0.0 /100 | #341 | Tragic $36,876 |
| Hopi | 0.0 /100 | #342 | Tragic $36,871 |
| Pueblo | 0.0 /100 | #343 | Tragic $36,859 |
Demographics Similar to Immigrants from China by Median Earnings
In terms of median earnings, the demographic groups most similar to Immigrants from China are Immigrants from Ireland ($56,854, a difference of 0.38%), Immigrants from Australia ($56,305, a difference of 0.59%), Indian (Asian) ($56,253, a difference of 0.68%), Immigrants from Israel ($57,034, a difference of 0.70%), and Immigrants from Eastern Asia ($56,183, a difference of 0.81%).
| Demographics | Rating | Rank | Median Earnings |
| Immigrants | Singapore | 100.0 /100 | #6 | Exceptional $59,038 |
| Iranians | 100.0 /100 | #7 | Exceptional $58,474 |
| Immigrants | Iran | 100.0 /100 | #8 | Exceptional $57,612 |
| Okinawans | 100.0 /100 | #9 | Exceptional $57,550 |
| Immigrants | South Central Asia | 100.0 /100 | #10 | Exceptional $57,114 |
| Immigrants | Israel | 100.0 /100 | #11 | Exceptional $57,034 |
| Immigrants | Ireland | 100.0 /100 | #12 | Exceptional $56,854 |
| Immigrants | China | 100.0 /100 | #13 | Exceptional $56,638 |
| Immigrants | Australia | 100.0 /100 | #14 | Exceptional $56,305 |
| Indians (Asian) | 100.0 /100 | #15 | Exceptional $56,253 |
| Immigrants | Eastern Asia | 100.0 /100 | #16 | Exceptional $56,183 |
| Eastern Europeans | 100.0 /100 | #17 | Exceptional $55,084 |
| Immigrants | Japan | 100.0 /100 | #18 | Exceptional $54,938 |
| Immigrants | Belgium | 100.0 /100 | #19 | Exceptional $54,679 |
| Cypriots | 100.0 /100 | #20 | Exceptional $54,589 |